U.S. flag

An official website of the United States government

Images

Images of Yellowstone.

Filter Total Items: 725
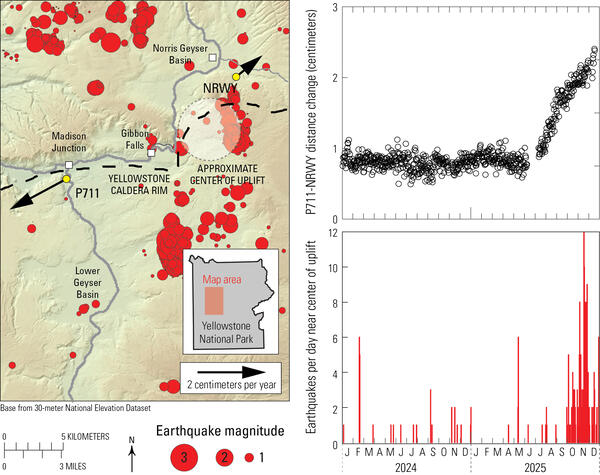
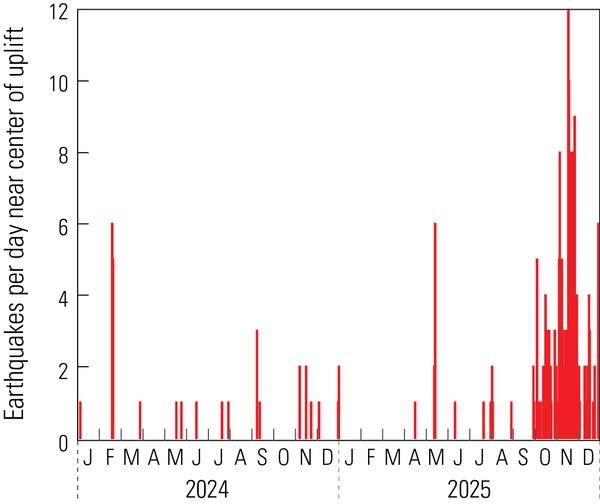
column plot showing numbers of earthquakes per day, with increased seismicity in September-December 2025
Plot of daily earthquakes located in the area of the Norris Uplift Anomaly during 2024-2025

Plot of numbers of earthquakes per day in the immediate vicinity of the Norris Uplift Anomaly during 2024-2025.  An increase in the rate of seismicity occurred in September-December 2025, especially in November.  The largest earthquake during that time was M2.7.

Plot of numbers of earthquakes per day in the immediate vicinity of the Norris Uplift Anomaly during 2024-2025.  An increase in the rate of seismicity occurred in September-December 2025, especially in November.  The largest earthquake during that time was M2.7.

The same hot spring shown with lots of sticks and rocks and red in color, and cleaned of debris and clear to gray in color
Hot spring along trail to Grand Prismatic Spring overlook before and after remediation

Hot spring located along the trail to the Grand Prismatic Spring overlook shown before and after the Yellowstone National Park Geology Program team cleaned the feature of sticks and rocks that were thrown in by visitors.  National Park Service photos by Margery Price, July and September 2025,

Hot spring located along the trail to the Grand Prismatic Spring overlook shown before and after the Yellowstone National Park Geology Program team cleaned the feature of sticks and rocks that were thrown in by visitors.  National Park Service photos by Margery Price, July and September 2025,

colorful map of Yellowstone and cross section with earthquakes near Yellowstone lake, and water pathways at various depths
Geological conditions in Yellowstone National Park during borehole microbiological study in 2021

Geological conditions in Yellowstone National Park during borehole microbiological study in 2021. Top panel (a) shows a map view of Yellowstone National Park, with different map colors representing water bodies and various rock types.

Red line with values that increase in jumps, jumps correspond to large numbers or large energy of earthquakes
Total energy absorbed from Yellowstone earthquakes during May to November 2021

Plot showing total energy absorbed from earthquakes throughout the May to November 2021 sampling period of a microbial study in Yellowstone National Park. The five different sampling windows are distinguished by shading, and Julian Day is the number of the day within the year (so Julian Day 200, for example, was July 19, 2021).

Plot showing total energy absorbed from earthquakes throughout the May to November 2021 sampling period of a microbial study in Yellowstone National Park. The five different sampling windows are distinguished by shading, and Julian Day is the number of the day within the year (so Julian Day 200, for example, was July 19, 2021).

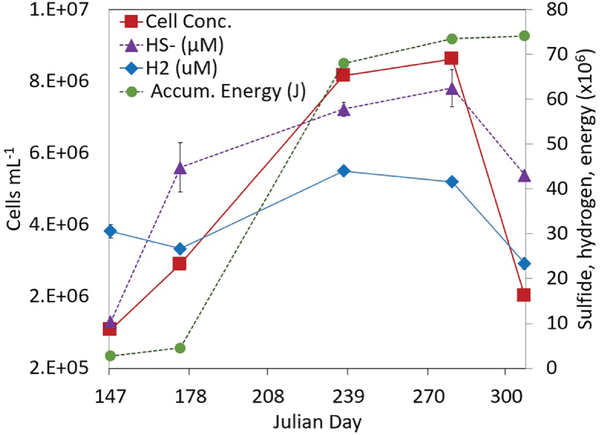
all values rise over time to the middle-late part of the plot, then decrease to previous levels
Changes in chemical concentrations in a Yellowstone borehole along with seismicity, all during May–November 2021

Changes in concentrations of hydrogen (H2), sulfide (HS-), and cells, and the accumulated seismic energy during May–November 2021, when microbial samples were collected from a borehole near West Thumb in Yellowstone National Park.

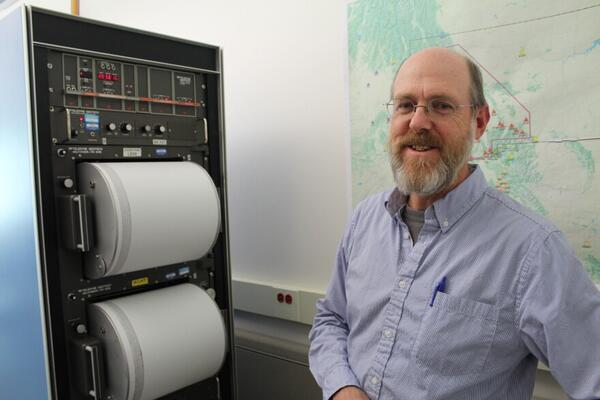
A man stands in front of a machine holding two drums covered in paper that records seismic data
Mike Stickney, Montana Bureau of Mines and Geology seismologist

Mike Stickney in front of one of the original seismograph drum recorders for the Montana Regional Seismic Network at the Montana Bureau of Mines and Geology Earthquake Studies Office. Today all earthquake data in Montana are recorded digitally from a large network of about 50 stations, including many telemetered broadband stations.

Mike Stickney in front of one of the original seismograph drum recorders for the Montana Regional Seismic Network at the Montana Bureau of Mines and Geology Earthquake Studies Office. Today all earthquake data in Montana are recorded digitally from a large network of about 50 stations, including many telemetered broadband stations.

infographic with pie charts showing hat types and colors, maps showing locations, and logos that were on recovered hats
Infographic with statistics about hats that were recovered from thermal areas in Yellowstone National Park during 2025

Infographic showing the numbers, styles, colors, and other data regarding hats recovered from thermal areas by the Yellowstone National Park Geology Program in 2025.  Designed by Margery Price, Yellowstone National Park.

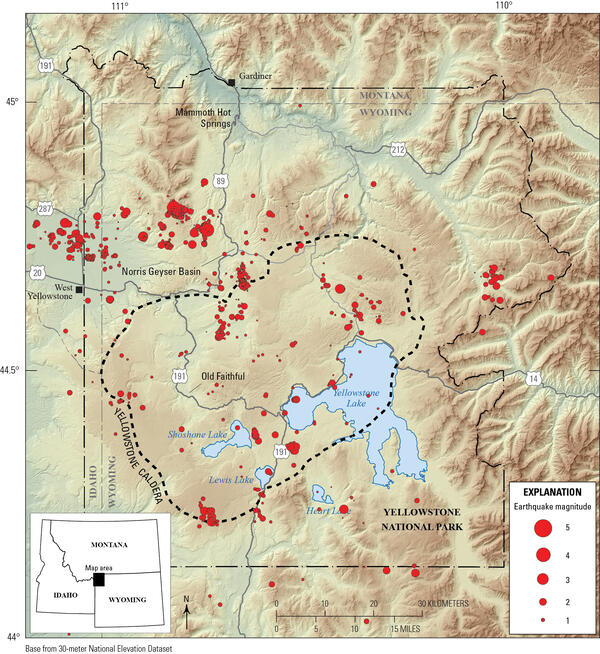
Map view and cross section with tightly clustered earthquakes depicting fluid-fault interaction in the Yellowstone area
Relocated Yellowstone seismicity recorded during 2008-2022

Map view of relocated Yellowstone seismicity recorded during 2008-2022, colored by time, on the left.  White line gives the outline of Yellowstone caldera. The A-A’ cross section through Yellowstone Lake is shown at the right and illustrates how seismic swarms that are distinct in time relate to one another.  Adapted from Florez and others, 2025 (

Map view of relocated Yellowstone seismicity recorded during 2008-2022, colored by time, on the left.  White line gives the outline of Yellowstone caldera. The A-A’ cross section through Yellowstone Lake is shown at the right and illustrates how seismic swarms that are distinct in time relate to one another.  Adapted from Florez and others, 2025 (

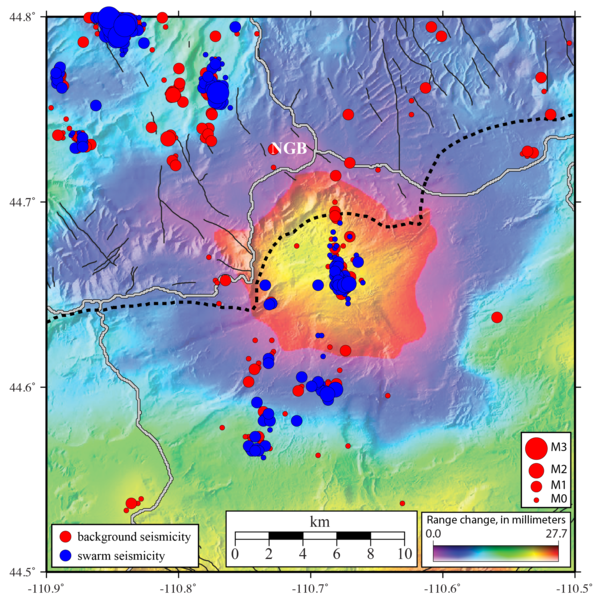
Colorful map of Yellowstone region with bullseyes of color on the north caldera rim and east caldera.
InSAR data from the Yellowstone region spanning October 7, 2024 to October 2, 2025

Interferogram created from satellite radar data collected on October 7, 2024, and October 2, 2025, over the Yellowstone region by the Sentinel-1 satellite system. Colored fringes indicate a change in distance (called range change) between the satellite and ground surface that is caused by surface deformation during the time spanned.

Interferogram created from satellite radar data collected on October 7, 2024, and October 2, 2025, over the Yellowstone region by the Sentinel-1 satellite system. Colored fringes indicate a change in distance (called range change) between the satellite and ground surface that is caused by surface deformation during the time spanned.

Map of Yellowstone with colored triangles and boxes showing locations, types, and operators for seismic stations
Yellowstone seismic network

Map of seismic stations in the Yellowstone region, with numbers of channels indicated by number and sensor type by color.  Inverted triangles indicate stations operated by University of Utah Seismograph Stations (UUSS), and squares indicate stations operated by other agencies.

Map of seismic stations in the Yellowstone region, with numbers of channels indicated by number and sensor type by color.  Inverted triangles indicate stations operated by University of Utah Seismograph Stations (UUSS), and squares indicate stations operated by other agencies.

A man and a woman work next to a tower with electronics equipment. Tools are scattered on the grass. Sparse trees behind.
Upgrading the WLWY continuous GPS site in Yellowstone National Park

EarthScope engineers Brendan Hodge (left) and Lia Lajoie (right) perform upgrades at the WLWY (White Lake) continuous GPS station in Yellowstone National Park.  The white box contains the receiver, while the barrel on the ground contains batteries.  The tower holds the solar panels, as well as a cellular modem and meteorological sensors that were recently

EarthScope engineers Brendan Hodge (left) and Lia Lajoie (right) perform upgrades at the WLWY (White Lake) continuous GPS station in Yellowstone National Park.  The white box contains the receiver, while the barrel on the ground contains batteries.  The tower holds the solar panels, as well as a cellular modem and meteorological sensors that were recently

Hundreds of hats laid out for display with a truck in the background providing a sense of scale
Hats collected by the Yellowstone National Park Geology Program from sensitive thermal areas in 2025

Just some of the hats collected by the Yellowstone National Park Geology Program from sensitive thermal areas throughout the park in 2025.  National Park Service photo by Margery Price, September 3, 2025.

Rock outcrop in the midst of a forest with a person standing on top collecting a sample
USGS geologist collects a sample from a potential newly recognized lava flow along the Gibbon River, Yellowstone National Park

USGS geologists Mark Stelten (pictured) and Nicole Thomas collect a sample of what is potentially a newly recognized lava flow exposed along the Gibbon River. USGS photo by Nicole Thomas, September 2025.

plot showing spikes in temperature due to geyser eruptions over a 6-hour period in August 2025
Temperature record from Valentine and Guardian Geysers, Norris Geyser Basin, Yellowstone National Park, from August 24, 2025

Plot of temperatures measured by continuous loggers at Guardian Geyser (light red) and Valentine Geyser (dark red) on August 24, 2025. Activity at Guardian Geyser included episodic splashing for a few hours prior to the near-simultaneous eruptions of both geysers just after 6:30 a.m. MDT on this date.  Data collected by Mara Reed, Yellowstone National Park.

Plot of temperatures measured by continuous loggers at Guardian Geyser (light red) and Valentine Geyser (dark red) on August 24, 2025. Activity at Guardian Geyser included episodic splashing for a few hours prior to the near-simultaneous eruptions of both geysers just after 6:30 a.m. MDT on this date.  Data collected by Mara Reed, Yellowstone National Park.

Barren hillside with steaming that marks the locations of two geysers
Valentine and Guardian Geysers, Norris Geyser Basin, Yellowstone National Park

Photo of Valentine Geyser and Guardian Geyser in eruption on August 7, 2025. Valentine Geyser is in the rear of the alcove, and Guardian Geyser is at the alcove’s mouth, closer to the camera. Visitors on a trail below the Norris Geyser Basin Museum can be seen at the top of the image. Photo by Carol Beverly, used with permission.

Photo of Valentine Geyser and Guardian Geyser in eruption on August 7, 2025. Valentine Geyser is in the rear of the alcove, and Guardian Geyser is at the alcove’s mouth, closer to the camera. Visitors on a trail below the Norris Geyser Basin Museum can be seen at the top of the image. Photo by Carol Beverly, used with permission.

Smiling woman standing on a boardwalk and holding an open pizza box. Scrubby ground and forested hill in background.
Removing trash from Geyser Hill, Yellowstone National Park

Yellowstone National Park Geology Program volunteer Tara Cross smiles and shows off a pizza box found on Geyser Hill in Upper Geyser Basin. National Park Service photo by Margery Price, August 2025.

Yellowstone National Park Geology Program volunteer Tara Cross smiles and shows off a pizza box found on Geyser Hill in Upper Geyser Basin. National Park Service photo by Margery Price, August 2025.

Black gloved hand holding rock sample coated in green algae-like bacteria
Sample of thermophilic cyanobacteria collected from a hot spring in Yellowstone’s Lower Geyser Basin

A researcher holds a vibrant green sample of thermophilic cyanobacteria collected from a hot spring in Yellowstone’s Lower Geyser Basin. National Park Service photo by Samantha Hilburn, August 2025.

person wearing safety vest and rubber bots and gloves at the edge of a colorful hot spring scraping a bacteria sample
Sampling thermophilic cyanobacteria from a hot spring in Yellowstone's Lower Geyser Basin

A researcher collects a sample of thermophilic cyanobacteria from a hot spring in Yellowstone's Lower Geyser Basin. National Park Service photo by Samantha Hilburn, August 2025.

Woman in red vest standing on white terrace in front of reddish hot spring under blue sky. Mountains in the background.
Extracting wind-blown litter from a thermal feature in Yellowstone National ark

Yellowstone National Park Geology Program team member Mara Reed uses a long grabber pole to remove a park map, presumably blown from a visitor's hand or pack by the wind, from a feature in Upper Mammoth Terraces. National Park Service photo by Samantha Hilburn, August 2025.

Yellowstone National Park Geology Program team member Mara Reed uses a long grabber pole to remove a park map, presumably blown from a visitor's hand or pack by the wind, from a feature in Upper Mammoth Terraces. National Park Service photo by Samantha Hilburn, August 2025.

Woman in red vest fastens warning sign to wooden barrier. River, meadow, and forested hill in background.
Yellowstone National Park geology team installs safety signage near a hot spring

Yellowstone National Park Geology Program team member Margery Price installs a thermal danger sign near Maiden’s Grave Spring along Fountain Flat Drive. National Park Service photo by Samantha Hilburn, August 2025.

Was this page helpful?