
This a version of the logo for the Python Hyperspectral Analysis Tool (PyHAT). It is intended for use in info boxes on the USGS website. The spectrum in the graphic is a laser induced breakdown spectroscopy spectrum, plotted on a logarithmic y axis to emphasize weaker emission peaks.
Multimedia
Welcome to the Astrogeology Multimedia Gallery. Browse here for some of our available imagery, educational videos, and audios. We may get permission to use some non-USGS images and these should be marked and are subject to copyright laws. USGS Astrogeology images can be freely downloaded.
Images
Python Hyperspectral Analysis Tool (PyHAT) Logo
This a version of the logo for the Python Hyperspectral Analysis Tool (PyHAT). It is intended for use in info boxes on the USGS website. The spectrum in the graphic is a laser induced breakdown spectroscopy spectrum, plotted on a logarithmic y axis to emphasize weaker emission peaks.
Python Hyperspectral Analysis Tool (PyHAT) Data Format Example
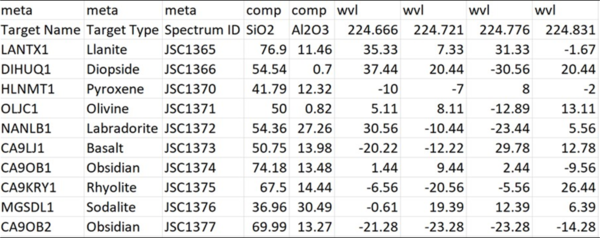
Screenshot showing the simple data format used by the Python Hyperspectral Analysis Tool (PyHAT). Spectra are stored in rows of the table, along with their associated metadata and compositional information.
Screenshot showing the simple data format used by the Python Hyperspectral Analysis Tool (PyHAT). Spectra are stored in rows of the table, along with their associated metadata and compositional information.

MSL image of the Martian Surface on sol 4158
This image was taken of the Martian surface by the NASA MSL rover on sol 4158, showing an assortment of clasts.
This image was taken of the Martian surface by the NASA MSL rover on sol 4158, showing an assortment of clasts.

Python Hyperspectral Analysis Tool (PyHAT) Banner Image
This image is intended as a summary/promotional image for the Python Hyperspectral Analysis Tool (PyHAT) software.
This image is intended as a summary/promotional image for the Python Hyperspectral Analysis Tool (PyHAT) software.
Python Hyperspectral Analysis Tool (PyHAT) Mineral Parameter Map Example - Jezero Crater, Mars
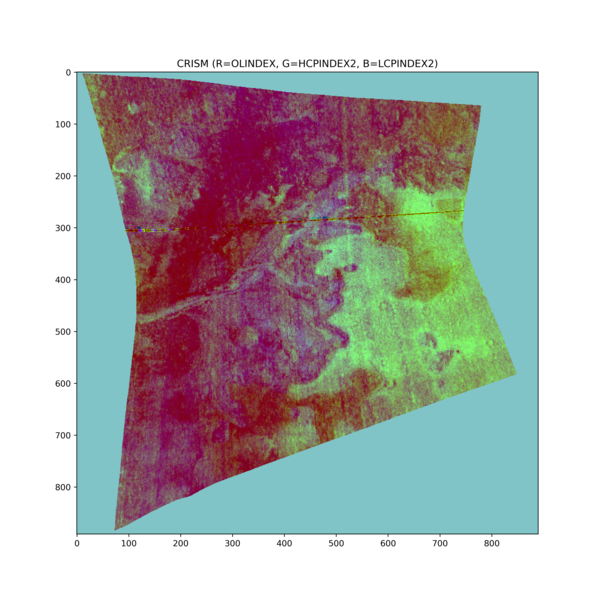
This figure shows an example mineral parameter map image generated using PyHAT. The area in this Compact Reconnaissance Imaging Spectrometer for Mars (CRISM) image is Jezero crater, the landing site of NASA's Mars Perseverance rover.
This figure shows an example mineral parameter map image generated using PyHAT. The area in this Compact Reconnaissance Imaging Spectrometer for Mars (CRISM) image is Jezero crater, the landing site of NASA's Mars Perseverance rover.
Python Hyperspectral Analysis Tool (PyHAT) Baseline Removal Plot Example
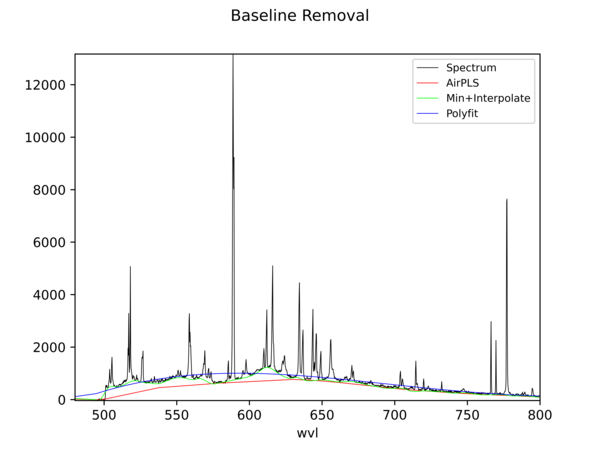
This figure shows an example spectrum plot generated using PyHAT. The black line is a laser induced breakdown spectroscopy (LIBS) spectrum of a basalt sample. The colored lines show the baseline estimated using several different algorithms.
This figure shows an example spectrum plot generated using PyHAT. The black line is a laser induced breakdown spectroscopy (LIBS) spectrum of a basalt sample. The colored lines show the baseline estimated using several different algorithms.
Videos

Creating and editing Geologic Units using the PGM Toolbox
In this demonstration video, you will learn how to create and update geologic unit polygons using the PGM Toolbox Build Polygons tool. The PGM toolbox is online.
In this demonstration video, you will learn how to create and update geologic unit polygons using the PGM Toolbox Build Polygons tool. The PGM toolbox is online.

Two planets merging by giant impact
Computer simulation of two planets undergoing a giant impact that results in a merger (accretion). The larger (target) body is one tenth the mass of the Earth and the smaller (impactor) body is 70% the mass of the target. The planets are colliding at 1.08 times their mutual escape velocity, which equates to 3.63 km/s.
Computer simulation of two planets undergoing a giant impact that results in a merger (accretion). The larger (target) body is one tenth the mass of the Earth and the smaller (impactor) body is 70% the mass of the target. The planets are colliding at 1.08 times their mutual escape velocity, which equates to 3.63 km/s.

Two planets undergoing a hit-and-run impact
Computer simulation of two planets undergoing a hit-and-run giant impact. This style of collision comprises around half of the giant impacts expected to occur during the latter stages of Solar System formation. The larger (target) body is one tenth the mass of the Earth and the smaller (impactor) body is 70% the mass of the target.
Computer simulation of two planets undergoing a hit-and-run giant impact. This style of collision comprises around half of the giant impacts expected to occur during the latter stages of Solar System formation. The larger (target) body is one tenth the mass of the Earth and the smaller (impactor) body is 70% the mass of the target.

The disruption of two planets in a giant impact
Computer simulation of two planets undergoing a disruptive giant impact. Disruptive collisions are not expected to be common in Solar System formation and due to numerical effects, the amount of disruption shown here is likely overestimated. The larger (target) body is one tenth the mass of the Earth and the smaller (impactor) body is 70% the mass of the target.
Computer simulation of two planets undergoing a disruptive giant impact. Disruptive collisions are not expected to be common in Solar System formation and due to numerical effects, the amount of disruption shown here is likely overestimated. The larger (target) body is one tenth the mass of the Earth and the smaller (impactor) body is 70% the mass of the target.

Flying Over Valles Marineris, Mars with Analysis-Ready Data
Flyover of Valles Marineris, the "Grand Canyon" of Mars, highlighting two analysis-ready datasets provided by USGS. The canyon is more than 4,000 km (2,500 miles) long and up to 7 km (23,000 ft) deep.
Flyover of Valles Marineris, the "Grand Canyon" of Mars, highlighting two analysis-ready datasets provided by USGS. The canyon is more than 4,000 km (2,500 miles) long and up to 7 km (23,000 ft) deep.

Demo: Creating custom projections in ArcGIS Pro
In this demo, you will learn how to create a custom projection in ArcGIS Pro, using data that is not located on Earth. For this example, we will use the Lunar Reconnaissance Orbiter (LRO) Wide Angle Camera (WAC) mosaic of the Moon, and create custom polar and equatorial projections.
In this demo, you will learn how to create a custom projection in ArcGIS Pro, using data that is not located on Earth. For this example, we will use the Lunar Reconnaissance Orbiter (LRO) Wide Angle Camera (WAC) mosaic of the Moon, and create custom polar and equatorial projections.
Audio

Terrestrial Analog - Meet Lauren
I'm Lauren Edgar. I'm a research geologist at the USGS astrogeology Science Center here in Flagstaff AZ
I'm Lauren Edgar. I'm a research geologist at the USGS astrogeology Science Center here in Flagstaff AZ
Terrestrial Analog - Meet Kristen
My name is Kristen Bennett. I'm at the Astrogeology Science Center and I've been there since 2018.
My name is Kristen Bennett. I'm at the Astrogeology Science Center and I've been there since 2018.