Region_Astro_leadership_GrandCanyon_June3_2026.JPG
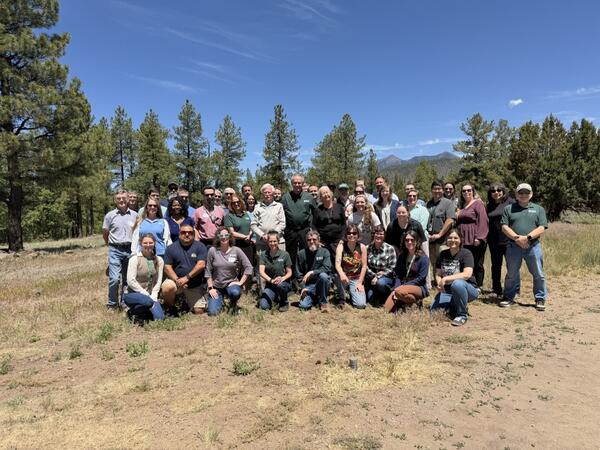
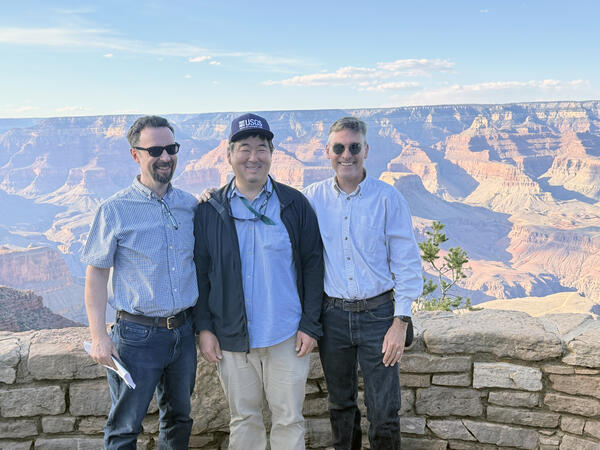
Region_Astro_leadership_GrandCanyon_June3_2026.JPGThis photo was taken at the South Rim of the Grand Canyon after Southwest Biological Science Center, Arizona Water Science Center, and Geology, Minerals, Energy, and Geophysics Science Center briefed USGS Director Ned Mamula on their work at the Canyons.