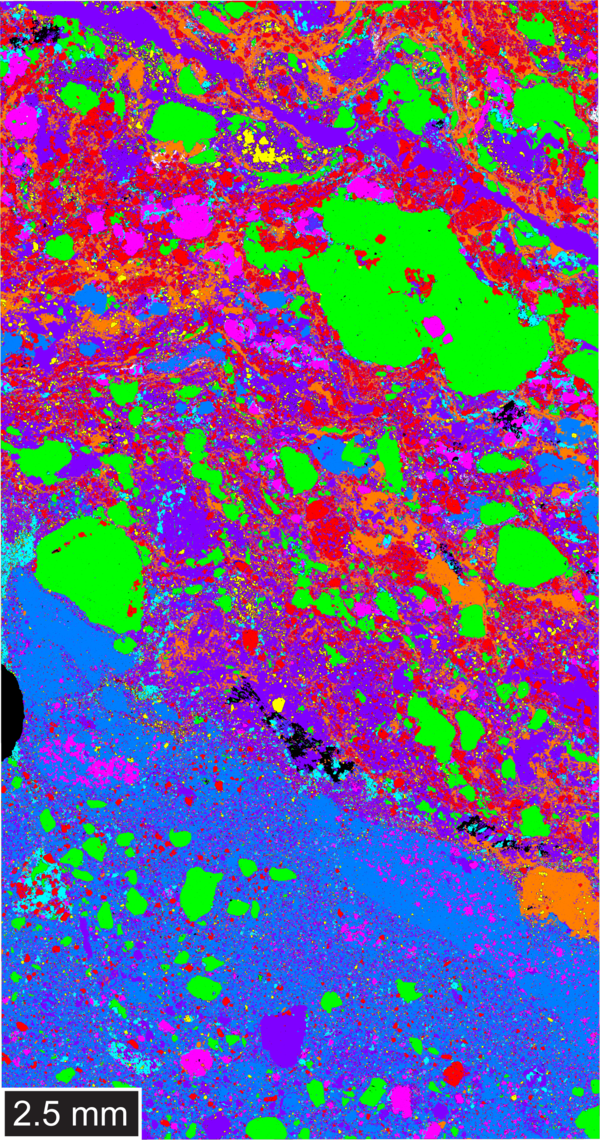
Schematic cross section showing examples of chemical, mechanical, and thermal geologic energy storage methods in potential underground settings in a sedimentary basin. This illustration is a higher resolution version of figure 2 of USGS Fact Sheet 2022-3084.
Images
Listed below are images directly associated with the Geology, Energy & Minerals Science Center:
Schematic cross section showing examples of chemical, mechanical, and thermal geologic energy storage methods in potential underground settings in a sedimentary basin. This illustration is a higher resolution version of figure 2 of USGS Fact Sheet 2022-3084.
Typical energy storage capacity compared to typical discharge duration for various geologic and nongeologic energy storage methods
linkFigure 3 from USGS Fact Sheet 2022-3082. Graph of typical energy storage capacity compared to typical discharge duration for various geologic and nongeologic energy storage methods. Oval sizes are estimated based on current technology. Modified from Crotogino and others (2017) and Matos and others (2019).
Map of the continental United States indicating the well density per 100 square mile grid cell of 117,672 unplugged orphaned wells in the 27 states included in the documented orphaned oil and gas well (DOW) dataset. Note the exponential scale of the coloring scheme used to preserve detail across both lower and higher well densities.
Oil, gas, and water separation vessels at a carbon dioxide enhanced oil recovery operation, Horseshoe Atoll, Upper Pennsylvanian Wolfcampian play in the Permian Basin Province in Texas.
Grand Canyon National Park from Powell Point on the South Rim. Photo taken during a ceremony commemorating the 150th anniversary of the John Wesley Powell expedition.
One charge of the U.S. Geological Survey’s Energy Resources Science Center is performing description
and analysis of hydrocarbon source rocks as input to USGS oil and gas assessments. This 2018 image
shows a coring and geophysical well-logging operation adjacent to U.S. Route 90, Kinney County, Texas.
Large layered nodule from the Roadside pit, Spor Mountain, Utah, showing fluorite, opal, and bertrandite mineralization. Beryllium is concentrated in the outer opal-fluorite zone; such samples can contain as much as 1-percent beryllium as bertrandite.
Illustration showing examples of environmental contaminant source and transport pathways. This illustration is a higher resolution version of figure 4 of USGS Circular 1383-E and figure 1 of USGS Open-file Report 2015-1113.
Illustration showing examples of infectious disease transmission pathways. This illustration is a higher resolution version of figure 5 of USGS Circular 1383-E.
The illustration visually conveys the following environmental health priority topics of study:
Illustration showing examples of infectious disease transmission pathways. This illustration is a higher resolution version of figure 5 of USGS Circular 1383-E.
The illustration visually conveys the following environmental health priority topics of study:
The use of carbon dioxide (CO2) injection for enhanced oil recovery (EOR) can prolong the productivity of many oil reservoirs and increase the U.S. hydrocarbon recoverable resource volume.
A carbon dioxide (CO2) injection well drilled by the Southeast Regional Carbon Sequestration Partnership (sponsored by the U.S. Department of Energy) at the Cranfield CO2 test site in Mississippi. The well was drilled to test the effectiveness of injecting and storing CO2 in a deep saline reservoir.
Mineralized section in the Cerro Maimón copper-gold-silver mine in the Dominican Replublic.
Mine trucks transporting material from the Cripple Creek and Victor Gold Mine in Colorado.