
Time-lapse cameras on Barter Island, North Slope of Alaska, incurred damage from polar bears who used the camera pole as a scratching post.
Images
Pacific Coastal and Marine Science Center images.
Filter Total Items: 1362

Camera mount as scratching pole - the aftermath
Time-lapse cameras on Barter Island, North Slope of Alaska, incurred damage from polar bears who used the camera pole as a scratching post.

Otter Rock, Oregon.
Otter Rock, Oregon. The Oregon coast is one of the areas that could be affected by a large earthquake on the Cascadia subduction zone.
Otter Rock, Oregon. The Oregon coast is one of the areas that could be affected by a large earthquake on the Cascadia subduction zone.

Resurrection Bay on August 8, 2016.
Resurrection Bay on August 8, 2016. The water appeared calm in the shelter of the inner bay, but closer to the entrance, swells coming in from the Gulf of Alaska were breaking on a small beach where the three boaters had capsized.
Resurrection Bay on August 8, 2016. The water appeared calm in the shelter of the inner bay, but closer to the entrance, swells coming in from the Gulf of Alaska were breaking on a small beach where the three boaters had capsized.

Diving Molokini Crater
A diver examines the coral reef along Molokini Crater off of the island of Maui, Hawaii.
A diver examines the coral reef along Molokini Crater off of the island of Maui, Hawaii.

Phosphorite rock
Phosphorite rock formed on the seafloor in Southern California.
Phosphorite rock formed on the seafloor in Southern California.

Potential Marine Benthic Habitats of Monterey Canyon and Vicinity
Potential Marine Benthic Habitats of Monterey Canyon and VicinityThe map on sheet 7 shows “potential” marine benthic habitats in the Monterey Canyon and Vicinity map area, representing a substrate type, geomorphology, seafloor process, or any other attribute that may provide a habitat for a specific species or assemblage of organisms.

Tripod with instruments on reef flat off Jurabi
Tripod deployed on the reef flat off Jurabi, Ningaloo World Heritage Site, Western Australia, with instrumentation designed to measure tides, waves, currents, and sediment being transported across the reef.
Tripod deployed on the reef flat off Jurabi, Ningaloo World Heritage Site, Western Australia, with instrumentation designed to measure tides, waves, currents, and sediment being transported across the reef.

Lettuce coral with cerulean and domino damselfish
Cerulean damselfish dart around lettuce coral off the Cape Range National Park along the Ningaloo Coast in Western Australia. USGS researchers combined forces with Australian colleagues in this UNESCO World Heritage Site to conduct the most extensive study of how erosion of reefs contribute sand to the beaches—a coast’s natural armor.
Cerulean damselfish dart around lettuce coral off the Cape Range National Park along the Ningaloo Coast in Western Australia. USGS researchers combined forces with Australian colleagues in this UNESCO World Heritage Site to conduct the most extensive study of how erosion of reefs contribute sand to the beaches—a coast’s natural armor.

Tripod with instruments on shallow seafloor
Tripod holding instruments and cameras used to measure and study aspects of sediment movement in and around the reef.
Tripod holding instruments and cameras used to measure and study aspects of sediment movement in and around the reef.

Winners of the USGS 2016 Shoemaker Award for Communication Excellence
Winners of the USGS 2016 Shoemaker Award for Communication ExcellenceIn May 2016, Susan Russell-Robinson (Associate Coordinator of the USGS Coastal and Marine Geology Program, third from right) and Dave Applegate (USGS Associate Director for Natural Hazards, left) celebrated with the team whose website “USGS Coastal and Marine Geology Program (CMGP, now called CMHRP

Bent Sea Rod Bleaching
A colony of the soft coral known as the "bent sea rod" stands bleached on a reef off of Islamorada, Florida. Hard and soft corals are presently bleaching- losing their symbiotic algae – all over the coral reefs of the Florida Keys due to unusually warm ocean temperatures this summer.
A colony of the soft coral known as the "bent sea rod" stands bleached on a reef off of Islamorada, Florida. Hard and soft corals are presently bleaching- losing their symbiotic algae – all over the coral reefs of the Florida Keys due to unusually warm ocean temperatures this summer.

Collecting Bathymetric Data
Physical scientist Jackson Currie steers a personal water craft (PWC) equipped with GPS and echo sounder through the waves of the nearshore area of Zmudowski State Beach in Moss Landing, California.
Physical scientist Jackson Currie steers a personal water craft (PWC) equipped with GPS and echo sounder through the waves of the nearshore area of Zmudowski State Beach in Moss Landing, California.

Multichannel seismic streamer
A ship will tow this green cable, which contains underwater microphones that record sound reflected off layers beneath the seafloor. USGS scientists will use the data to pinpoint the location of faults.
A ship will tow this green cable, which contains underwater microphones that record sound reflected off layers beneath the seafloor. USGS scientists will use the data to pinpoint the location of faults.

Using seafloor maps to plan further mapping
USGS geologist Jamie Conrad uses a map of the seafloor off Southern California to plan high-resolution mapping southwest of Santa Catalina Island. Small inset shows seafloor data collected by the ship that reveals hills, gullies, and basins.
USGS geologist Jamie Conrad uses a map of the seafloor off Southern California to plan high-resolution mapping southwest of Santa Catalina Island. Small inset shows seafloor data collected by the ship that reveals hills, gullies, and basins.
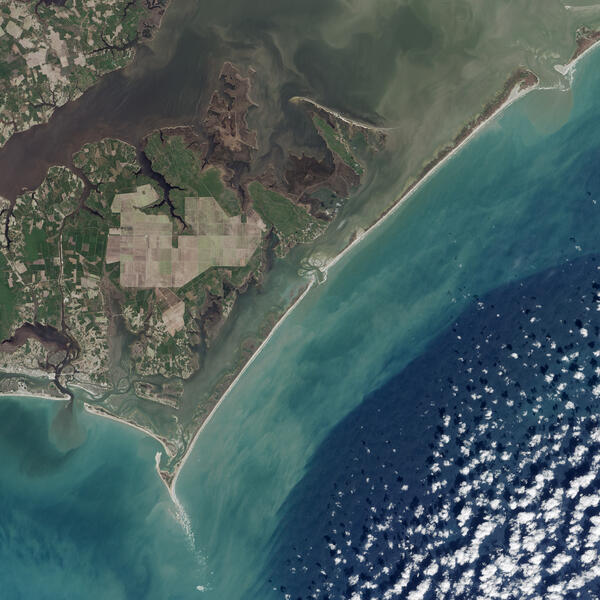
Satellite image of Cape Lookout National Seashore, NC
Satellite image of Cape Lookout National Seashore, NCSatellite image of Cape Lookout National Seashore, NC, taken by Landsat 8 on February 18, 2016.
Satellite image of Cape Lookout National Seashore, NC
Satellite image of Cape Lookout National Seashore, NCSatellite image of Cape Lookout National Seashore, NC, taken by Landsat 8 on February 18, 2016.

Large waves breaking on cliffs in Santa Cruz, California, 02/13/2016
Large waves breaking on cliffs in Santa Cruz, California, 02/13/2016Large waves breaking on cliffs in western Santa Cruz, California, February 13, 2016.
Large waves breaking on cliffs in Santa Cruz, California, 02/13/2016
Large waves breaking on cliffs in Santa Cruz, California, 02/13/2016Large waves breaking on cliffs in western Santa Cruz, California, February 13, 2016.

Nanopod Deployment
The USGS Coastal and Estuarine Dynamics Group will be deploying a Nanopod at Pea Island DUNEX experiment site to collect oceanographic information.
The USGS Coastal and Estuarine Dynamics Group will be deploying a Nanopod at Pea Island DUNEX experiment site to collect oceanographic information.

USGS scientists survey a beach near San Francisco
USGS scientists survey a beach near San Francisco to assist with a comparison of data derived from aerial photos and lidar.
USGS scientists survey a beach near San Francisco to assist with a comparison of data derived from aerial photos and lidar.

Santa Cruz coastal erosion
The coastal bluff along East Cliff Drive in Santa Cruz, California are especially vulnerable to rising sea level during big storms. Sometimes even the rip-rap, put in place to protect roadways and homes, cannot protect the bluffs from erosion.
The coastal bluff along East Cliff Drive in Santa Cruz, California are especially vulnerable to rising sea level during big storms. Sometimes even the rip-rap, put in place to protect roadways and homes, cannot protect the bluffs from erosion.

Flooded Coastal Road Santa Cruz County California
Waves flood across a coastal road near Santa Cruz, California.
Waves flood across a coastal road near Santa Cruz, California.

Santa Cruz, California's Main Beach in winter
View of the Santa Cruz Beach Boardwalk amusement park in Santa Cruz, California. Photo was taken from the bluff on East Cliff Drive, east of the San Lorenzo River mouth. Sand on the beach gets eroded, redistributed, and deposited due to the dynamic conditions brought about by storms and changing river flow.
View of the Santa Cruz Beach Boardwalk amusement park in Santa Cruz, California. Photo was taken from the bluff on East Cliff Drive, east of the San Lorenzo River mouth. Sand on the beach gets eroded, redistributed, and deposited due to the dynamic conditions brought about by storms and changing river flow.