
Lake Powell is a large arid reservoir that represents about 70% of the water storage capacity for the Upper Colorado River Basin. It is the second largest reservoir in the United States by capacity (second only to Lake Mead). Lake Powell is an oligotrophic reservoir, which means that nutrient concentrations and algal production are generally low. This often results in very clear-water conditions, with an average secchi (water transparency) depth of 9 meters at a long-term monitoring site near the dam (period of record 1985-2020).
Lake Powell operational tier water levels
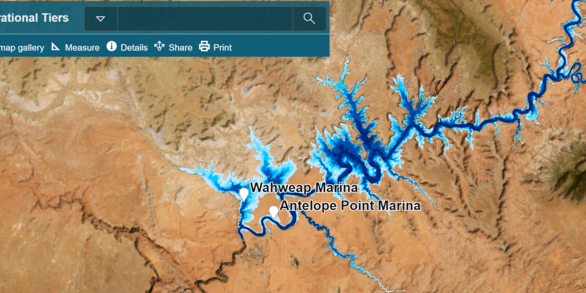
A Lake Powell water level interactive application. This has several defined lake elevation water levels represented as color-shaded polygons of the extent of the reservoir at each of the operational tiers.
Colorado River real-time water quality data directly below Glen Canyon Dam
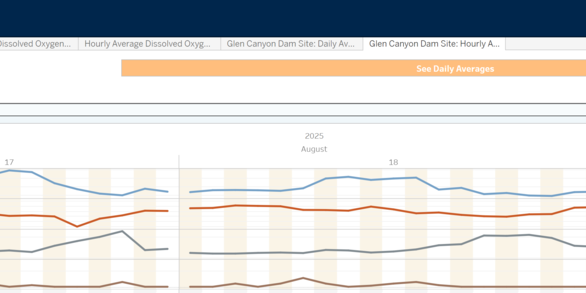
A Colorado River real-time water quality data interactive application. This shows water quality in the Colorado River directly below Glen Canyon Dam.
Lake Powell Water Quality Monitoring Program

The Lake Powell water quality monitoring program began in 1965 over concerns that Colorado River basin-wide salinity levels were increasing. The monitoring program collects data on water-quality conditions at the forebay of the reservoir (2.4 km from the dam) on a monthly basis and at 25-30 sites during quarterly 4-5 day reservoir surveys. The data collected as part of this program represents a unique and valuable long-term record of water temperatures, dissolved oxygen concentrations, major ions and, more recently (beginning in 1990), nutrients and biological constituents (Vernieu, 2015). The program is an interagency collaboration between the Bureau of Reclamation, the National Park Service, and the U.S. Geological Survey.
Lake Powell and the 21st Century Mega-Drought

Lake Powell has experienced dramatic fluctuations in water levels, from full capacity at 3700 ft above sea level in 1983, to a historic low of 177 ft below its full elevation in May 2022. Under low water levels, large regions of shoreline sediment in the reservoir become exposed. Dried sediments can be re-mobilized during spring inflow and can cause low oxygen conditions in the middle of the reservoir water column that can then be transported towards the dam. These low oxygen conditions develop when remobilized sediment stimulates both biological and chemical processes that use up oxygen. These low oxygen regions, termed metalimnetic low dissolved events, are a cause of concern for dam managers for two main reasons. The low dissolved oxygen concentrations pose corrosion concerns in the dam and can be harmful to fish populations in the Glen Canyon reach of the river (before rapids are able to mix oxygen back into the river). Work led by the U.S. Geological Survey aims to better characterize sediment oxygen use to inform existing dissolved oxygen modeling.
Lake Powell Biogeochemistry

Like many human-made reservoirs, Lake Powell transforms key aspects of water quality, altering downstream physio-chemical conditions. Lake Powell retains large amounts of sediment in its inlet regions, with some areas estimated to accumulate 2 to 3 meters of sediment a year. With this sediment retention, large amounts of phosphorus are also retained—reducing the downstream transport of this biologically necessary element by anywhere between 95 and 99%. Phosphorus is an important nutrient that supports algae growth and overall foodbase productivity for the downstream ecosystem. Some of the same processes that cause phosphorus retention in Lake Powell also reduce salinity and alkalinity — these reductions help meet downstream Colorado River salinity water quality standards. A recent mass balance study using historical water quality data collected by this program and by the U.S. Geological Survey water science center estimated that Lake Powell reduces the total downstream transport of salt by ~10% (Deemer and others, 2020).
Southwest Reservoir Greenhouse Gas Survey

Lakes and reservoirs are a significant global source of methane, a potent greenhouse gas. Still, little is known about how to predict methane emissions from arid reservoirs. In 2021, the U.S. Geological Survey measured greenhouse gas fluxes from 10 reservoirs in AZ, UT, and CA as part of a national reservoir survey being led by the Environmental Protection Agency (https://www.epa.gov/air-research/research-emissions-us-reservoirs). They also conducted a one-time survey of greenhouse gas emissions in Lake Powell to compare measurements with existing models of emissions (Waldo and others, 2021).
Lake Powell by the Numbers
-
Formed in 1963
-
Took 17 years to fill
-
Capacity >24 million acre-feet (MAF)
-
1850 miles of shoreline when full
-
557 feet deep when full
-
Water residence time is about 2 years on average
-
Has more than 95 tributary arms
-
Water levels have varied over 175 feet since full capacity was reached


Hydrocarbon Monitoring in Response to Personal Watercraft Regulation at Glen Canyon National Recreation Area
Lake Powell is a large arid reservoir that represents about 70% of the water storage capacity for the Upper Colorado River Basin. It is the second largest reservoir in the United States by capacity (second only to Lake Mead). Lake Powell is an oligotrophic reservoir, which means that nutrient concentrations and algal production are generally low. This often results in very clear-water conditions, with an average secchi (water transparency) depth of 9 meters at a long-term monitoring site near the dam (period of record 1985-2020).
Lake Powell operational tier water levels
A Lake Powell water level interactive application. This has several defined lake elevation water levels represented as color-shaded polygons of the extent of the reservoir at each of the operational tiers.
Colorado River real-time water quality data directly below Glen Canyon Dam
A Colorado River real-time water quality data interactive application. This shows water quality in the Colorado River directly below Glen Canyon Dam.
Lake Powell Water Quality Monitoring Program
The Lake Powell water quality monitoring program began in 1965 over concerns that Colorado River basin-wide salinity levels were increasing. The monitoring program collects data on water-quality conditions at the forebay of the reservoir (2.4 km from the dam) on a monthly basis and at 25-30 sites during quarterly 4-5 day reservoir surveys. The data collected as part of this program represents a unique and valuable long-term record of water temperatures, dissolved oxygen concentrations, major ions and, more recently (beginning in 1990), nutrients and biological constituents (Vernieu, 2015). The program is an interagency collaboration between the Bureau of Reclamation, the National Park Service, and the U.S. Geological Survey.
Lake Powell and the 21st Century Mega-Drought
Lake Powell has experienced dramatic fluctuations in water levels, from full capacity at 3700 ft above sea level in 1983, to a historic low of 177 ft below its full elevation in May 2022. Under low water levels, large regions of shoreline sediment in the reservoir become exposed. Dried sediments can be re-mobilized during spring inflow and can cause low oxygen conditions in the middle of the reservoir water column that can then be transported towards the dam. These low oxygen conditions develop when remobilized sediment stimulates both biological and chemical processes that use up oxygen. These low oxygen regions, termed metalimnetic low dissolved events, are a cause of concern for dam managers for two main reasons. The low dissolved oxygen concentrations pose corrosion concerns in the dam and can be harmful to fish populations in the Glen Canyon reach of the river (before rapids are able to mix oxygen back into the river). Work led by the U.S. Geological Survey aims to better characterize sediment oxygen use to inform existing dissolved oxygen modeling.
Lake Powell Biogeochemistry
Like many human-made reservoirs, Lake Powell transforms key aspects of water quality, altering downstream physio-chemical conditions. Lake Powell retains large amounts of sediment in its inlet regions, with some areas estimated to accumulate 2 to 3 meters of sediment a year. With this sediment retention, large amounts of phosphorus are also retained—reducing the downstream transport of this biologically necessary element by anywhere between 95 and 99%. Phosphorus is an important nutrient that supports algae growth and overall foodbase productivity for the downstream ecosystem. Some of the same processes that cause phosphorus retention in Lake Powell also reduce salinity and alkalinity — these reductions help meet downstream Colorado River salinity water quality standards. A recent mass balance study using historical water quality data collected by this program and by the U.S. Geological Survey water science center estimated that Lake Powell reduces the total downstream transport of salt by ~10% (Deemer and others, 2020).
Southwest Reservoir Greenhouse Gas Survey
Lakes and reservoirs are a significant global source of methane, a potent greenhouse gas. Still, little is known about how to predict methane emissions from arid reservoirs. In 2021, the U.S. Geological Survey measured greenhouse gas fluxes from 10 reservoirs in AZ, UT, and CA as part of a national reservoir survey being led by the Environmental Protection Agency (https://www.epa.gov/air-research/research-emissions-us-reservoirs). They also conducted a one-time survey of greenhouse gas emissions in Lake Powell to compare measurements with existing models of emissions (Waldo and others, 2021).
Lake Powell by the Numbers
-
Formed in 1963
-
Took 17 years to fill
-
Capacity >24 million acre-feet (MAF)
-
1850 miles of shoreline when full
-
557 feet deep when full
-
Water residence time is about 2 years on average
-
Has more than 95 tributary arms
-
Water levels have varied over 175 feet since full capacity was reached