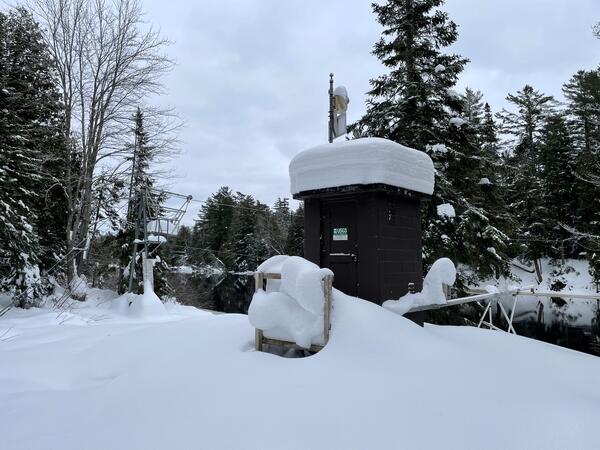
The wire weight is lowered to determine stage of Bull Lake Creek above Bull Lake
What does the term "stream stage" mean?
Stream stage is an important concept when analyzing how much water is moving in a stream at any given moment. "Stage" is the water level above some arbitrary point in the river and is commonly measured in feet. For example, on a normal day when no rain has fallen for a while, a river might have a stage of 2 feet. If a big storm hits, the river stage could rise to 15 or 20 feet, sometimes very quickly. This is important because past records might tell us that when the stage hits 21 feet, the water will start flowing over its banks and into the basements of houses along the river -- time to tell those people to move out! With modern technology, the USGS can monitor the stage of many streams almost instantly.
Hydrologists are able to convert stage height into streamflow volume by determining a rating curve for each site.
Learn more:
Related Content
Is there a way to get alerts about streamflow conditions?
Yes! The U.S. Geological Survey WaterAlert service provides notifications to your email or phone for changes in water conditions based on thresholds you choose.
Why does the USGS use the spelling "gage" instead of "gauge"?
The spelling of “gage” is part of our very rich USGS history. We have used that spelling for over a hundred years. In 1888, USGS Director John Wesley Powell met a very forward-thinking graduate student named Frederick Haynes Newell. Powell was so impressed that he made Newell the first full-time appointee to the new Irrigation Survey, which was created to investigate the potential for dams and...
Why are there sometimes differences between USGS and National Weather Service river stages?
At some USGS streamgage installations, NOAA’s National Weather Service (NWS) maintains a separate stage sensor that is serviced by NWS technicians. Calibration of any sensing device can occasionally drift from a "true" value, so there might be differences between USGS and NWS data reports. USGS personnel visit installations on an interval of 6 weeks or less to maintain equipment and make required...
Does "stage" tell you how much water is flowing in a stream?
Not directly. You cannot say that because a stream rises (doubles) from a 10-foot stage to a 20-foot stage that the amount of flowing water also doubles. Think of a cereal bowl with a rounded bottom. Pour one inch of milk in it. It doesn't take much milk to make it up to the one inch level because the bowl is at its narrowest near the bottom. Now, pour in milk until it is two inches deep -- it...
Sometimes the USGS real-time stage data seems too high (or too low). Are the USGS data inaccurate?
There can be occasional equipment or database problems where erroneous data are reported for short periods of time until corrections can be made. This is why it is important to look at a record of streamflow (like the 7-day hydrograph plots) rather than a single point in time. However, most of the time the USGS has a high level of confidence in its real-time stage data. During low streamflow...
Where can I get real-time and historical streamflow information?
The best starting point for USGS streamflow data is the interactive National Water Information System (NWIS): Mapper website. Zoom in to your area of interest or use the search options in the left navigation window. The map displays active surface-water sites by default, but you can change the type of water site (surface-water, groundwater, springs, atmospheric) and select to show inactive sites...
Where can I find flood maps?
FEMA is the official public source for flood maps for insurance purposes: FEMA’s Flood Map Service Center FEMA’s National Flood Hazard Layer NOAA is responsible for producing flood forecast maps that combine precipitation data with USGS streamflow data: National Weather Service - Advanced Hydrologic Prediction Service River Forecasts Long-Range River Flood Risk Coastal Inundation Dashboard : Real...
How can I obtain river forecasts (flood forecasts)?
River forecasts (flood forecasts) are made by the National Weather Service River Forecast Centers and released through local Weather Service Offices. This NOAA website has a map showing the location of the forecast centers, their areas of responsibility, and by clicking into a region the location of the gages they use. The also provide a section for long-range river flood risk . The vast majority...
The wire weight is lowered to determine stage of Bull Lake Creek above Bull Lake
USGS staff gage (ruler) measuring the height of the water, on the Carson River, near Brunswick Canyon, Nevada.
A staff gage at the Bonnet Carré Spillway, which is managed by the U.S. Army Corps of Engineers.
A USGS streamgage measures flooding in the lower Trinity River, Texas.
USGS employee, Hanna Coy, talks about stream gauging.
USGS employees talk about the importance of getting accurate data from stream gauging and the benefit of the stage discharge ratings class.
Water level measurement from the USGS Red River of the North at Fargo streamgage in downtown Fargo, ND. The water level peaked at around 39 feet at this streamgage on April 9. Real-time water level and streamflow data from this gage can be accessed online.
Whether you drink water from your tap, use electricity or canoe down your local river, chances are you benefit from USGS streamgage information. So what is a streamgage and what does it do for you? This CoreCast episode gives you the inside scoop on your silent superhero.
Transcript and captions available soon.
StreamStats—A quarter century of delivering web-based geospatial and hydrologic information to the public, and lessons learned
Streamflow—Water year 2020
How does a U.S. Geological Survey streamgage work?
Discharge measurements at gaging stations
From the River to You: USGS Real-Time Streamflow Information...from the National Streamflow Information Program
Stage-discharge relations -- basic concepts
The stream-gaging program of the U.S. Geological Survey
Related Content
- FAQ
Is there a way to get alerts about streamflow conditions?
Yes! The U.S. Geological Survey WaterAlert service provides notifications to your email or phone for changes in water conditions based on thresholds you choose.
Why does the USGS use the spelling "gage" instead of "gauge"?
The spelling of “gage” is part of our very rich USGS history. We have used that spelling for over a hundred years. In 1888, USGS Director John Wesley Powell met a very forward-thinking graduate student named Frederick Haynes Newell. Powell was so impressed that he made Newell the first full-time appointee to the new Irrigation Survey, which was created to investigate the potential for dams and...
Why are there sometimes differences between USGS and National Weather Service river stages?
At some USGS streamgage installations, NOAA’s National Weather Service (NWS) maintains a separate stage sensor that is serviced by NWS technicians. Calibration of any sensing device can occasionally drift from a "true" value, so there might be differences between USGS and NWS data reports. USGS personnel visit installations on an interval of 6 weeks or less to maintain equipment and make required...
Does "stage" tell you how much water is flowing in a stream?
Not directly. You cannot say that because a stream rises (doubles) from a 10-foot stage to a 20-foot stage that the amount of flowing water also doubles. Think of a cereal bowl with a rounded bottom. Pour one inch of milk in it. It doesn't take much milk to make it up to the one inch level because the bowl is at its narrowest near the bottom. Now, pour in milk until it is two inches deep -- it...
Sometimes the USGS real-time stage data seems too high (or too low). Are the USGS data inaccurate?
There can be occasional equipment or database problems where erroneous data are reported for short periods of time until corrections can be made. This is why it is important to look at a record of streamflow (like the 7-day hydrograph plots) rather than a single point in time. However, most of the time the USGS has a high level of confidence in its real-time stage data. During low streamflow...
Where can I get real-time and historical streamflow information?
The best starting point for USGS streamflow data is the interactive National Water Information System (NWIS): Mapper website. Zoom in to your area of interest or use the search options in the left navigation window. The map displays active surface-water sites by default, but you can change the type of water site (surface-water, groundwater, springs, atmospheric) and select to show inactive sites...
Where can I find flood maps?
FEMA is the official public source for flood maps for insurance purposes: FEMA’s Flood Map Service Center FEMA’s National Flood Hazard Layer NOAA is responsible for producing flood forecast maps that combine precipitation data with USGS streamflow data: National Weather Service - Advanced Hydrologic Prediction Service River Forecasts Long-Range River Flood Risk Coastal Inundation Dashboard : Real...
How can I obtain river forecasts (flood forecasts)?
River forecasts (flood forecasts) are made by the National Weather Service River Forecast Centers and released through local Weather Service Offices. This NOAA website has a map showing the location of the forecast centers, their areas of responsibility, and by clicking into a region the location of the gages they use. The also provide a section for long-range river flood risk . The vast majority...
- Multimedia
Reading stream stage at Bull Lake Creek above Bull Lake streamgageReading stream stage at Bull Lake Creek above Bull Lake streamgage
The wire weight is lowered to determine stage of Bull Lake Creek above Bull Lake
USGS staff gage measuring the height of the water in the Carson RiverUSGS staff gage measuring the height of the water in the Carson RiverUSGS staff gage (ruler) measuring the height of the water, on the Carson River, near Brunswick Canyon, Nevada.
USGS staff gage (ruler) measuring the height of the water, on the Carson River, near Brunswick Canyon, Nevada.
Staff Gage at Bonnet Carré SpillwayA staff gage at the Bonnet Carré Spillway, which is managed by the U.S. Army Corps of Engineers.
A staff gage at the Bonnet Carré Spillway, which is managed by the U.S. Army Corps of Engineers.
USGS streamgage measures flooding in the lower Trinity RiverUSGS streamgage measures flooding in the lower Trinity RiverA USGS streamgage measures flooding in the lower Trinity River, Texas.
A USGS streamgage measures flooding in the lower Trinity River, Texas.
Streamflow Gaging Station and Measurement on San Pedro River, AZStreamflow Gaging Station and Measurement on San Pedro River, AZStreamflow Gaging Station and Measurement on San Pedro River, AZUSGS employee, Hanna Coy, talks about stream gauging.
USGS employee, Hanna Coy, talks about stream gauging.
Stage Discharge Ratings ClassUSGS employees talk about the importance of getting accurate data from stream gauging and the benefit of the stage discharge ratings class.
USGS employees talk about the importance of getting accurate data from stream gauging and the benefit of the stage discharge ratings class.
USGS Red River of the North at Fargo StreamgageWater level measurement from the USGS Red River of the North at Fargo streamgage in downtown Fargo, ND. The water level peaked at around 39 feet at this streamgage on April 9. Real-time water level and streamflow data from this gage can be accessed online.
Water level measurement from the USGS Red River of the North at Fargo streamgage in downtown Fargo, ND. The water level peaked at around 39 feet at this streamgage on April 9. Real-time water level and streamflow data from this gage can be accessed online.
Streamgages: The Silent SuperheroWhether you drink water from your tap, use electricity or canoe down your local river, chances are you benefit from USGS streamgage information. So what is a streamgage and what does it do for you? This CoreCast episode gives you the inside scoop on your silent superhero.
Transcript and captions available soon.
Whether you drink water from your tap, use electricity or canoe down your local river, chances are you benefit from USGS streamgage information. So what is a streamgage and what does it do for you? This CoreCast episode gives you the inside scoop on your silent superhero.
Transcript and captions available soon.
- Publications
StreamStats—A quarter century of delivering web-based geospatial and hydrologic information to the public, and lessons learned
StreamStats is a U.S. Geological Survey (USGS) web application that provides streamflow statistics, such as the 1-percent annual exceedance probability peak flow, the mean flow, and the 7-day, 10-year low flow, to the public through a map-based user interface. These statistics are used in many ways, such as in the design of roads, bridges, and other structures; in delineation of floodplains for laAuthorsKernell G. Ries, Peter A. Steeves, Peter M. McCarthyStreamflow—Water year 2020
The maps and graphs in this summary describe national streamflow conditions for water year 2020 (October 1, 2019, to September 30, 2020) in the context of streamflow ranks relative to the 91-year period of water years 1930–2020. Annual runoff in the Nation’s rivers and streams during water year 2020 (11.10 inches) was higher than the long-term (1930–2020) mean annual runoff of 9.40 inches for theAuthorsXiaodong Jian, David M. Wolock, Harry F. Lins, Ronald J. Henderson, Steven J. BradyHow does a U.S. Geological Survey streamgage work?
Information on the flow of rivers and streams is a vital national asset that safeguards lives, protects property, and ensures adequate water supplies for the future. The U.S. Geological Survey (USGS) operates a network of more than 9,000 streamgages nationwide with more than 500 in Texas.AuthorsDee L. LurryDischarge measurements at gaging stations
The techniques and standards for making discharge measurements at streamflow gaging stations are described in this publication. The vertical axis rotating-element current meter, principally the Price current meter, has been traditionally used for most measurements of discharge; however, advancements in acoustic technology have led to important developments in the use of acoustic Doppler current prAuthorsD. Phil Turnipseed, Vernon B. SauerFrom the River to You: USGS Real-Time Streamflow Information...from the National Streamflow Information Program
This Fact Sheet is one in a series that highlights information or recent research findings from the USGS National Streamflow Information Program (NSIP). The investigations and scientific results reported in this series require a nationally consistent streamgaging network with stable long-term monitoring sites and a rigorous program of data, quality assurance, management, archiving, and synthesis.AuthorsJoseph P. Nielsen, J. Michael NorrisStage-discharge relations -- basic concepts
No abstract available.AuthorsK. Michael Nolan, Larry Bohman, Tim Stamey, Gary FirdaThe stream-gaging program of the U.S. Geological Survey
The U.S. Geological Survey stream-gaging program provides streamflow data for a variety of purposes. The uses of streamflow data are described, and the growth of the stream-gaging program is related to legislation and the need to manage the Nation's water resources more effectively. A brief description is provided of the data-collection processes, computation of streamflow records, dissemination oAuthorsKenneth L. Wahl, Wilbert O. Thomas, Robert M. Hirsch - News