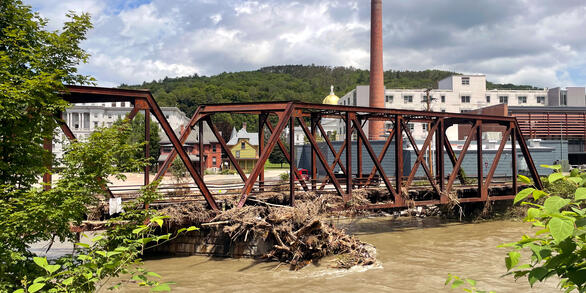
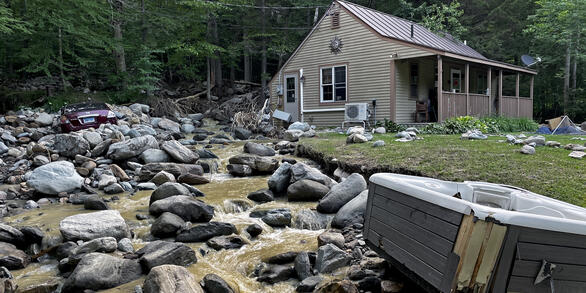
A look at the high waters and damage caused by a significant two-day rainfall event in New England in early July 2023. USGS researchers visited streamgages, manually captured discharge and river stage (or height), and canvassed for high-water marks in Vermont.
From July 9 through July 12, 2023, 3 to 9 inches of rain fell within 48 hours across the state of Vermont, causing catastrophic flooding and millions of dollars in damage. The high amount of rain caused several rivers to peak at record levels, in some cases exceeding records set during Tropical Storm Irene in 2011.

The U.S. Geological Survey, in cooperation with the Federal Emergency Management Agency (FEMA), collected and analyzed data that characterized the flood in Vermont.
The data collected included: 500 peak water-surface elevations from high-water marks at bridges, dams, and roads and peak streamflow and annual exceedance probabilities (AEPs) at streamgages, lake gages, and selected ungaged locations. At 11 out of 80 streamgages with 12 to 94 years of record, the July 2023 peak streamflow was the highest recorded streamflow. Ten streamgages recorded a peak streamflow with an AEP less than or equal to 1 percent (greater than or equal to a 100-year recurrence interval).
USGS is updating Vermont’s peakflow regression equations to include this event and 11 years of additional data.


New England Flood Information
Data for the Estimation of Flood Discharges at Selected Annual Exceedance Probabilities for Unregulated, Rural Streams in Vermont, 2023 Data for the Estimation of Flood Discharges at Selected Annual Exceedance Probabilities for Unregulated, Rural Streams in Vermont, 2023
Vermont Flood of July 2023 Data Vermont Flood of July 2023 Data
A look at the high waters and damage caused by a significant two-day rainfall event in New England in early July 2023. USGS researchers visited streamgages, manually captured discharge and river stage (or height), and canvassed for high-water marks in Vermont.
 A streamgage house on the bank of a river with heavy water flow.
A USGS Hydrologic Technician manually measures the water level of Otter Creek in Center Rutland, Vermont one day after a torrential storm that led to devastating flash flooding in the state.
A USGS Hydrologic Technician manually measures the water level of Otter Creek in Center Rutland, Vermont one day after a torrential storm that led to devastating flash flooding in the state.
Flood Event Viewer Flood Event Viewer
From July 9 through July 12, 2023, 3 to 9 inches of rain fell within 48 hours across the state of Vermont, causing catastrophic flooding and millions of dollars in damage. The high amount of rain caused several rivers to peak at record levels, in some cases exceeding records set during Tropical Storm Irene in 2011.

The U.S. Geological Survey, in cooperation with the Federal Emergency Management Agency (FEMA), collected and analyzed data that characterized the flood in Vermont.
The data collected included: 500 peak water-surface elevations from high-water marks at bridges, dams, and roads and peak streamflow and annual exceedance probabilities (AEPs) at streamgages, lake gages, and selected ungaged locations. At 11 out of 80 streamgages with 12 to 94 years of record, the July 2023 peak streamflow was the highest recorded streamflow. Ten streamgages recorded a peak streamflow with an AEP less than or equal to 1 percent (greater than or equal to a 100-year recurrence interval).
USGS is updating Vermont’s peakflow regression equations to include this event and 11 years of additional data.


New England Flood Information
Data for the Estimation of Flood Discharges at Selected Annual Exceedance Probabilities for Unregulated, Rural Streams in Vermont, 2023 Data for the Estimation of Flood Discharges at Selected Annual Exceedance Probabilities for Unregulated, Rural Streams in Vermont, 2023
Vermont Flood of July 2023 Data Vermont Flood of July 2023 Data
A look at the high waters and damage caused by a significant two-day rainfall event in New England in early July 2023. USGS researchers visited streamgages, manually captured discharge and river stage (or height), and canvassed for high-water marks in Vermont.
A look at the high waters and damage caused by a significant two-day rainfall event in New England in early July 2023. USGS researchers visited streamgages, manually captured discharge and river stage (or height), and canvassed for high-water marks in Vermont.
 A streamgage house on the bank of a river with heavy water flow.
A USGS Hydrologic Technician manually measures the water level of Otter Creek in Center Rutland, Vermont one day after a torrential storm that led to devastating flash flooding in the state.
A USGS Hydrologic Technician manually measures the water level of Otter Creek in Center Rutland, Vermont one day after a torrential storm that led to devastating flash flooding in the state.


