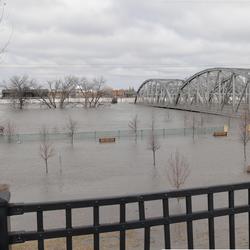
The USGS delivers continuous streamflow, stage (water-level), and tide data to help emergency managers and other decision makers protect life and property caused by floods and other water-related hazards.
The USGS New England Water Science Center maintains nearly 450 streamgages that collect data to determine the amount of water flowing in rivers and streams in Connecticut, Maine, Massachusetts, New Hampshire, Rhode Island, and Vermont. The Water Science Center also maintains about 15 tide gages along the coast of New England.
Nationwide, the USGS operates and maintains about 8,000 streamgages, which deliver near real-time data to the public.
Automatic alerts can be sent to mobile devices when streamflow of river or tide stage (water levels) reach user defined thresholds, such as a National Weather Service defined flood stage. These alerts help emergency managers and the public assess potentially hazardous conditions nearby a streamgage, stage-only gage, or tide gage.
USGS WaterNow sends data showing current water conditions directly to your mobile device.
USGS WaterAlert automatically sends email or SMS text messages when certain parameters at a USGS real-time data-collection station, exceed user-defined thresholds.
USGS Flood Information provides additional information about USGS flood science.

Current Flood Data for New England
- National Water Dashboard for New England
- WaterWatch Map of flood and high flow condition (select a State or Water-Resources Region)
- WaterWatch Map of flood and high flow conditions – New England
- USGS Project Alerts – Flood and Drought
- USGS Flood-Event Viewer (Data for Selected Current and Historic Floods – Coastal and Riverine)
- USGS Flood Inundation Mapper
- USGS Operational Total Water Level and Coastal Change Viewer
Current Streamflow, Stage, and Tide Data for New England
Flood Frequency Information
Visit USGS Floods and Recurrence Intervals for more information about floods and the annual exceedance probability (AEP).
New England Flood Frequency Studies
Flood Resources from Partner Agencies
Federal Emergency Management Agency (FEMA)
National Weather Service (NWS)
- NWS Northeast River Forecast Center
- NWS Current Precipitation Radar
- NWS Future Quantitative Precipitation Forecasts (1-7 day totals)
- NOAA Office of Water Prediction – National Water Model
Northeast River Forecast Center (NERFC)
- NERFC Daily Hydrometeorological Briefing
- Recent NERFC Observed Precipitation Maps
- NERFC 5-Day Significant River Flood Outlook
- NERFC Future Quantitative Precipitation Forecast (72 Hours)
State Emergency Management
U.S. Army Corps of Engineers
- U.S. Army Corps of Engineers – New England Reservoir Control Center
- U.S. Army Corps of Engineers Silver Jackets Program
Safety Related Resources
Below are resources associated with flood information.
USGS Flood Information
Rapid Deployment Gages (RDGs)
Surge, Wave, and Tide Hydrodynamics (SWaTH) Network
Historical Flooding
Flood Inundation Mapping (FIM) Program
Floods: Recurrence intervals and 100-year floods
How do we know or measure if a flood that could happen tomorrow is worse than one that happened 2, 10 or 50 years ago? If heavy rain is being forecasted does that mean that rivers are going to rise and spill over their banks and flood your neighborhood? These are some of the questions that we think about when flooding or heavy rain is forecast by public media or the National Weather Service (NWS).
The 100-Year Flood
Development of Flood Insurance Maps in New England
Northeast Region Flood Science Capability Team
Below are data or web applications associated with flood information.
Data and shapefiles used to document the floods associated with the January and March 2018 Nor'easters for Coastal Areas of New England
Below are publications associated with flood information.
Documentation and mapping of flooding from the January and March 2018 nor’easters in coastal New England
In January and March 2018, coastal Massachusetts experienced flooding from two separate nor’easters. To put the January and March floods into historical context, the USGS computed statistical stillwater elevations. Stillwater elevations recorded in January 2018 in Boston (9.66 feet relative to the North American Vertical Datum of 1988) have an annual exceedance probability of between 2 and 1 perce
Estimating flood magnitude and frequency on gaged and ungaged streams in Maine
Estimating flood magnitude and frequency on streams and rivers in Connecticut, based on data through water year 2015
Total water level data from the January and March 2018 nor’easters for coastal areas of New England
Preliminary stage and streamflow data at selected U.S. Geological Survey streamgages in New England for the floods of April 2019
The combination of rainfall and snowmelt in northern New England and rainfall in southern New England resulted in minor to major flooding from April 15 to 24, 2019, according to stage and streamflow data collected at 63 selected U.S. Geological Survey (USGS) streamgages. A typical USGS streamgage measures and records stream stage and estimates streamflow based on a relation (rating curve) of discr
Effects of climate, regulation, and urbanization on historical flood trends in the United States
Flood-inundation maps for the lower Pawcatuck River in Westerly, Rhode Island, and Stonington and North Stonington, Connecticut
Flood-inundation maps for the Pawtuxet River in West Warwick, Warwick, and Cranston, Rhode Island
Preliminary stage and streamflow data at selected U.S. Geological Survey streamgages in Maine and New Hampshire for the flood of October 30–31, 2017
Magnitude of flood flows for selected annual exceedance probabilities for streams in Massachusetts
Flood- and drought-related natural hazards activities of the U.S. Geological Survey in New England
Flood-inundation maps for the Hoosic River, North Adams and Williamstown, Massachusetts, from the confluence with the North Branch Hoosic River to the Vermont State line
Below are data or web applications associated with flood information.
WaterWatch (surface water)
WaterWatch displays maps, graphs, and tables describing real-time, recent, and past streamflow conditions for the United States, including flood and droughts. Real-time information generally is updated on an hourly basis.
Flood Inundation Mapper - New England
USGS Flood Inundation Mapper Web Application
WaterWatch Toolkit
The USGS WaterWatch Toolkit provides online tools that allow users to search USGS sites in various ways; create a variety of maps, graphs, charts, animations, and tables; perform a variety of streamflow analyses, and retrieve summary statistics.
Flood Inundation Mapper
USGS Flood Inundation Maps, along with Internet information regarding current stage from the USGS streamgage, provide emergency management personnel and residents with information that is critical for flood-response activities, such as evacuations and road closures, as well as for post-flood recovery efforts.
USGS StreamStats
StreamStats is a Web-based tool that provides streamflow statistics, drainage-basin characteristics, and other information for USGS streamgaging stations and for user-selected ungaged sites on streams. When users select the location of a streamgaging station, StreamStats provides previously published information from a database. When users select a site on an ungaged stream,
Below are FAQ associated with flood information.
Where can I find flood maps?
FEMA is the official public source for flood maps for insurance purposes: FEMA’s Flood Map Service Center FEMA’s National Flood Hazard Layer NOAA is responsible for producing flood forecast maps that combine precipitation data with USGS streamflow data: National Weather Service - Advanced Hydrologic Prediction Service River Forecasts Long-Range River Flood Risk Coastal Inundation Dashboard: Real...
What are the two types of floods?
There are two basic types of floods: flash floods and the more widespread river floods. Flash floods generally cause greater loss of life and river floods generally cause greater loss of property. A flash flood occurs when runoff from excessive rainfall causes a rapid rise in the water height (stage) of a stream or normally-dry channel. Flash floods are more common in areas with a dry climate and...
What is a 1,000-year flood?
The term “1,000-year flood” means that, statistically speaking, a flood of that magnitude (or greater) has a 1 in 1,000 chance of occurring in any given year. In terms of probability, the 1,000-year flood has a 0.1% chance of happening in any given year. These statistical values are based on observed data.
How can a 1,000-year rainfall not result in a 1,000-year flood?
It comes down to a number of factors, including the pattern of movement of the rainstorm in each particular watershed, the conditions of the soil and plant matter in the watershed, and the timing of the rainstorm in one watershed versus other watersheds. For example, if the ground is already saturated before a rainstorm, much of the rain will run off into streams, but if the ground is dry, it will...
Why do the values for the 100-year flood seem to change with every flood?
The amount of water corresponding to a 100-year flood, a 500-year flood, or a 1,000-year flood is known as a "flood quantile". For instance, on a given river, the flood quantile corresponding to the 50-year flood might be 10,000 cubic feet per second (cfs) and the flood quantile corresponding to the 100-year flood might be 15,000 cfs. The estimates of the flood quantiles are calculated using...
We had a "100-year flood" two years in a row. How can that be?
The term "100-year flood" is used to describe the recurrence interval of floods. The 100-year recurrence interval means that a flood of that magnitude has a one percent chance of occurring in any given year. In other words, the chances that a river will flow as high as the 100-year flood stage this year is 1 in 100. Statistically, each year begins with the same 1-percent chance that a 100-year...
Does an increase in the 100-year flood estimate originate from climate or land-use change?
Climate variability (dry cycles to wet cycles) and land-use change play a significant role, but there is a large amount of uncertainty around the flood quantile estimates (the value of discharge corresponding to the 100-year flood), particularly if there isn’t a long record of observed data at a stream location. Learn more: The 100-Year Flood The 100-Year Flood--It's All About Chance
How are floods predicted?
Flood predictions require several types of data: The amount of rainfall occurring on a real-time basis. The rate of change in river stage on a real-time basis, which can help indicate the severity and immediacy of the threat. Knowledge about the type of storm producing the moisture, such as duration, intensity and areal extent, which can be valuable for determining possible severity of the...
How can I obtain river forecasts (flood forecasts)?
River forecasts (flood forecasts) are made by the National Weather Service River Forecast Centers and released through local Weather Service Offices. This NOAA website has a map showing the location of the forecast centers, their areas of responsibility, and by clicking into a region the location of the gages they use. The also provide a section for long-range river flood risk. The vast majority...
Below are partners associated with flood information.
- Overview
The USGS delivers continuous streamflow, stage (water-level), and tide data to help emergency managers and other decision makers protect life and property caused by floods and other water-related hazards.
Flooding at the USGS streamgage Nashua River at Pepperell, MA (01096500) on March 17, 2010 at about 12:15 EDT at a gage height of 14.58 ft and discharge of 9,780 cubic feet per second. (Credit: Andrew Waite, U.S. Geological Survey, New York Water Science Center. Public domain.) The USGS New England Water Science Center maintains nearly 450 streamgages that collect data to determine the amount of water flowing in rivers and streams in Connecticut, Maine, Massachusetts, New Hampshire, Rhode Island, and Vermont. The Water Science Center also maintains about 15 tide gages along the coast of New England.
Nationwide, the USGS operates and maintains about 8,000 streamgages, which deliver near real-time data to the public.
Automatic alerts can be sent to mobile devices when streamflow of river or tide stage (water levels) reach user defined thresholds, such as a National Weather Service defined flood stage. These alerts help emergency managers and the public assess potentially hazardous conditions nearby a streamgage, stage-only gage, or tide gage.
USGS WaterNow sends data showing current water conditions directly to your mobile device.
USGS WaterAlert automatically sends email or SMS text messages when certain parameters at a USGS real-time data-collection station, exceed user-defined thresholds.
USGS Flood Information provides additional information about USGS flood science.
Sources/Usage: Some content may have restrictions. Visit Media to see details.Flood flows on the Deerfield River at dam #3 at Shelburne Falls, Massachusetts during tropical storm Irene on August 28, 2011. (Credit: John Elder Robison. Courtesy of ©John E. Robison, used with permission) Current Flood Data for New England
- National Water Dashboard for New England
- WaterWatch Map of flood and high flow condition (select a State or Water-Resources Region)
- WaterWatch Map of flood and high flow conditions – New England
- USGS Project Alerts – Flood and Drought
- USGS Flood-Event Viewer (Data for Selected Current and Historic Floods – Coastal and Riverine)
- USGS Flood Inundation Mapper
- USGS Operational Total Water Level and Coastal Change Viewer
Current Streamflow, Stage, and Tide Data for New England
Flood damage from tropical storm Irene, August 28, 2011, washed out Maxam Road bridge on the West Branch North River in Colrain, Massachusetts. (Credit: Andrew Waite, U.S. Geological Survey, New York Water Science Center. Public domain.) Flood Frequency Information
Visit USGS Floods and Recurrence Intervals for more information about floods and the annual exceedance probability (AEP).
New England Flood Frequency Studies
Flood damage to Eunice Williams Road in Greenfield, MA on the Green River from tropical storm Irene on August, 28, 2011. (Credit: Gardner Bent, U.S. Geological Survey, New England Water Science Center. Public domain.) Flood Resources from Partner Agencies
Federal Emergency Management Agency (FEMA)
National Weather Service (NWS)
- NWS Northeast River Forecast Center
- NWS Current Precipitation Radar
- NWS Future Quantitative Precipitation Forecasts (1-7 day totals)
- NOAA Office of Water Prediction – National Water Model
Northeast River Forecast Center (NERFC)
- NERFC Daily Hydrometeorological Briefing
- Recent NERFC Observed Precipitation Maps
- NERFC 5-Day Significant River Flood Outlook
- NERFC Future Quantitative Precipitation Forecast (72 Hours)
State Emergency Management
U.S. Army Corps of Engineers
- U.S. Army Corps of Engineers – New England Reservoir Control Center
- U.S. Army Corps of Engineers Silver Jackets Program
Safety Related Resources
- Science
Below are resources associated with flood information.
USGS Flood Information
The USGS collects flood data and conducts targeted flood science to help Federal, State, and local agencies, decision makers, and the public before, during, and after a flood. Our efforts provide situational awareness, drive predictive models, inform infrastructure design and operation, undergird floodplain mapping, assist flood constituent/load quantification, and facilitate flood impact...Rapid Deployment Gages (RDGs)
Rapid Deployment Gages (RDGs) are fully-functional streamgages designed to be deployed quickly and temporarily to measure and transmit stream stage data in emergency situations.Surge, Wave, and Tide Hydrodynamics (SWaTH) Network
During large coastal storms, the storm surge and waves are the main cause of destruction and landscape change, transporting saline water, sediment, and debris inland. The USGS, in collaboration with stakeholders, has constructed a national Surge, Wave, and Tide Hydrodynamics (SWaTH) Network for the Atlantic, Eastern Pacific, and Central Pacific. SWaTH monitors and documents the height, extent, and...Historical Flooding
The USGS provides practical, unbiased information about the Nation's rivers and streams that is crucial in mitigating hazards associated with floods. This site provides information about the USGS activities, data, and services provided during regional high-flow events, such as hurricanes or multi-state flooding events. The USGS response to these events is typically managed by the National Flood...Flood Inundation Mapping (FIM) Program
Floods are the leading cause of natural-disaster losses in the U.S. More than 75 percent of declared Federal disasters are related to floods, and annual flood losses average almost $8 billion with over 90 fatalities per year. Although the amount of fatalities has declined due to improved early warning systems, economic losses continue to rise with increased urbanization in flood-hazard areas.Floods: Recurrence intervals and 100-year floods
How do we know or measure if a flood that could happen tomorrow is worse than one that happened 2, 10 or 50 years ago? If heavy rain is being forecasted does that mean that rivers are going to rise and spill over their banks and flood your neighborhood? These are some of the questions that we think about when flooding or heavy rain is forecast by public media or the National Weather Service (NWS).
The 100-Year Flood
A 100-year flood happened last year so it won't happen for another 99 years, right? Not exactly. Misinterpretation of terminology often leads to confusion about flood recurrence intervals. Read on to learn more.Development of Flood Insurance Maps in New England
FEMA has requested USGS expertise in hydraulics, hydrology, and mapping to generate flood insurance maps for New England.Northeast Region Flood Science Capability Team
The USGS Northeast Region has been an active and competent force in flood-science through (1) maintenance of our streamgaging network to provide timely and accurate data to the National Weather Service, other federal (USACE and FEMA) and state agencies (Emergency Management Agencies), and the public in times of flood emergencies; (2) documentation of major floods; (3) involvement in the USGS Flood... - Data
Below are data or web applications associated with flood information.
Data and shapefiles used to document the floods associated with the January and March 2018 Nor'easters for Coastal Areas of New England
The U.S. Geological Survey (USGS) New England Water Science Center worked with the Federal Emergency Management Agency to document the floods of January 4, 2018 and March 2-4, 2018, in coastal Massachusetts. USGS conducted a frequency analysis of stillwater elevations at three National Oceanic and Atmospheric Administration coastal gages following the coastal floods of 2018. The data for these an - Multimedia
- Publications
Below are publications associated with flood information.
Filter Total Items: 54Documentation and mapping of flooding from the January and March 2018 nor’easters in coastal New England
In January and March 2018, coastal Massachusetts experienced flooding from two separate nor’easters. To put the January and March floods into historical context, the USGS computed statistical stillwater elevations. Stillwater elevations recorded in January 2018 in Boston (9.66 feet relative to the North American Vertical Datum of 1988) have an annual exceedance probability of between 2 and 1 perce
AuthorsPamela J. Lombard, Scott A. Olson, Luke P. Sturtevant, Rena D. KalmonEstimating flood magnitude and frequency on gaged and ungaged streams in Maine
Accurate estimates of flood frequency and magnitude on rivers and streams in Maine are a key component of effective flood risk management, flood mitigation, and flood recovery programs for the State. Flood-frequency estimates are published here for 148 streamgages in and adjacent to Maine. Equations are provided for users to compute flood-frequency estimates at any location on a stream that does nAuthorsPamela J. Lombard, Glenn A. HodgkinsEstimating flood magnitude and frequency on streams and rivers in Connecticut, based on data through water year 2015
The U.S. Geological Survey, in cooperation with the Connecticut Department of Transportation, updated flood-frequency estimates with 50-, 20-, 10-, 4-, 2-, 1-, 0.5-, and 0.2-percent annual exceedance probabilities (2-, 5-, 10-, 25-, 50-, 100-, 200-, and 500-year recurrence intervals, respectively) for 141 streamgages in Connecticut and 11 streamgages in adjacent States using annual peak-flow dataAuthorsElizabeth A. Ahearn, Glenn A. HodgkinsTotal water level data from the January and March 2018 nor’easters for coastal areas of New England
During winter 2017–18 coastal areas of New England were impacted by the January 4, and March 2–4, 2018, nor’easters. The U.S. Geological Survey (USGS), under an interagency agreement with the Federal Emergency Management Agency (FEMA), collected total water level data (the combination of tide, storm surge, wave runup and setup, and freshwater input) using the North American Vertical Datum of 1988AuthorsGardner C. Bent, Nicholas J. TaylorPreliminary stage and streamflow data at selected U.S. Geological Survey streamgages in New England for the floods of April 2019
The combination of rainfall and snowmelt in northern New England and rainfall in southern New England resulted in minor to major flooding from April 15 to 24, 2019, according to stage and streamflow data collected at 63 selected U.S. Geological Survey (USGS) streamgages. A typical USGS streamgage measures and records stream stage and estimates streamflow based on a relation (rating curve) of discr
AuthorsRichard G. Kiah, Brianna A. Smith, Nicholas W. StasulisEffects of climate, regulation, and urbanization on historical flood trends in the United States
Many studies have analyzed historical trends in annual peak flows in the United States because of the importance of flooding to bridges and other structures, and the concern that human influence may increase flooding. To help attribute causes of historical peak-flow changes, it is important to separate basins by characteristics that have different influences on peak flows. We analyzed historical tAuthorsGlenn Hodgkins, Robert Dudley, Stacey Archfield, Benjamin RenardFlood-inundation maps for the lower Pawcatuck River in Westerly, Rhode Island, and Stonington and North Stonington, Connecticut
A series of 11 digital flood-inundation maps was developed for a 5.5-mile reach of the lower Pawcatuck River in Westerly, Rhode Island, and Stonington and North Stonington, Connecticut, by the U.S. Geological Survey (USGS) in cooperation with the Town of Westerly, Rhode Island, and the Rhode Island Office of Housing and Community Development. The coverage of the maps extends from downstream from tAuthorsGardner C. Bent, Pamela J. LombardFlood-inundation maps for the Pawtuxet River in West Warwick, Warwick, and Cranston, Rhode Island
A series of 15 digital flood-inundation maps was developed for a 10.2-mile reach of the Pawtuxet River in the municipalities of West Warwick, Warwick, and Cranston, Rhode Island, by the U.S. Geological Survey (USGS), in cooperation with the Rhode Island Emergency Management Agency and the U.S. Army Corps of Engineers. The coverage of the maps extends downstream from Natick Pond dam near State RoutAuthorsGardner C. Bent, Pamela J. LombardPreliminary stage and streamflow data at selected U.S. Geological Survey streamgages in Maine and New Hampshire for the flood of October 30–31, 2017
Rainfall from a storm on October 24–27, 2017, and Tropical Storm Philippe on October 29–30, created conditions that led to flooding across portions of New Hampshire and western Maine. On the basis of streamflow data collected at 30 selected U.S. Geological Survey (USGS) streamgages in the Androscoggin River, Connecticut River, Merrimack River, and Saco River Basins, the storms caused minor to modeAuthorsRichard G. Kiah, Nicholas W. StasulisMagnitude of flood flows for selected annual exceedance probabilities for streams in Massachusetts
The U.S. Geological Survey, in cooperation with the Massachusetts Department of Transportation, determined the magnitude of flood flows at selected annual exceedance probabilities (AEPs) at streamgages in Massachusetts and from these data developed equations for estimating flood flows at ungaged locations in the State. Flood magnitudes were determined for the 50-, 20-, 10-, 4-, 2-, 1-, 0.5-, andAuthorsPhillip J. ZarrielloFlood- and drought-related natural hazards activities of the U.S. Geological Survey in New England
The U.S. Geological Survey (USGS) has many ongoing and recent water-related natural hazard activities in New England that can be used to help mitigate the effects of natural hazards in cooperation with other agencies. The themes related to potential hazards and the tools and science to better understand and address them include the following: Erosion and landslides • Fluvial erosion (sediment tranAuthorsPamela J. LombardFlood-inundation maps for the Hoosic River, North Adams and Williamstown, Massachusetts, from the confluence with the North Branch Hoosic River to the Vermont State line
A series of nine digital flood-inundation maps were developed for an 8-mile reach of the Hoosic River in North Adams and Williamstown, Massachusetts, by the U.S. Geological Survey (USGS) in cooperation with the Federal Emergency Management Agency. The coverage of the maps extends from the confluence with the North Branch Hoosic River to the Vermont State line. Peak flows with 20-, 10-, 4-, 2-, 1-,AuthorsPamela J. Lombard, Gardner C. Bent - Web Tools
Below are data or web applications associated with flood information.
WaterWatch (surface water)
WaterWatch displays maps, graphs, and tables describing real-time, recent, and past streamflow conditions for the United States, including flood and droughts. Real-time information generally is updated on an hourly basis.
Flood Inundation Mapper - New England
USGS Flood Inundation Mapper Web Application
WaterWatch Toolkit
The USGS WaterWatch Toolkit provides online tools that allow users to search USGS sites in various ways; create a variety of maps, graphs, charts, animations, and tables; perform a variety of streamflow analyses, and retrieve summary statistics.
Flood Inundation Mapper
USGS Flood Inundation Maps, along with Internet information regarding current stage from the USGS streamgage, provide emergency management personnel and residents with information that is critical for flood-response activities, such as evacuations and road closures, as well as for post-flood recovery efforts.
USGS StreamStats
StreamStats is a Web-based tool that provides streamflow statistics, drainage-basin characteristics, and other information for USGS streamgaging stations and for user-selected ungaged sites on streams. When users select the location of a streamgaging station, StreamStats provides previously published information from a database. When users select a site on an ungaged stream,
- News
- FAQ
Below are FAQ associated with flood information.
Where can I find flood maps?
FEMA is the official public source for flood maps for insurance purposes: FEMA’s Flood Map Service Center FEMA’s National Flood Hazard Layer NOAA is responsible for producing flood forecast maps that combine precipitation data with USGS streamflow data: National Weather Service - Advanced Hydrologic Prediction Service River Forecasts Long-Range River Flood Risk Coastal Inundation Dashboard: Real...
What are the two types of floods?
There are two basic types of floods: flash floods and the more widespread river floods. Flash floods generally cause greater loss of life and river floods generally cause greater loss of property. A flash flood occurs when runoff from excessive rainfall causes a rapid rise in the water height (stage) of a stream or normally-dry channel. Flash floods are more common in areas with a dry climate and...
What is a 1,000-year flood?
The term “1,000-year flood” means that, statistically speaking, a flood of that magnitude (or greater) has a 1 in 1,000 chance of occurring in any given year. In terms of probability, the 1,000-year flood has a 0.1% chance of happening in any given year. These statistical values are based on observed data.
How can a 1,000-year rainfall not result in a 1,000-year flood?
It comes down to a number of factors, including the pattern of movement of the rainstorm in each particular watershed, the conditions of the soil and plant matter in the watershed, and the timing of the rainstorm in one watershed versus other watersheds. For example, if the ground is already saturated before a rainstorm, much of the rain will run off into streams, but if the ground is dry, it will...
Why do the values for the 100-year flood seem to change with every flood?
The amount of water corresponding to a 100-year flood, a 500-year flood, or a 1,000-year flood is known as a "flood quantile". For instance, on a given river, the flood quantile corresponding to the 50-year flood might be 10,000 cubic feet per second (cfs) and the flood quantile corresponding to the 100-year flood might be 15,000 cfs. The estimates of the flood quantiles are calculated using...
We had a "100-year flood" two years in a row. How can that be?
The term "100-year flood" is used to describe the recurrence interval of floods. The 100-year recurrence interval means that a flood of that magnitude has a one percent chance of occurring in any given year. In other words, the chances that a river will flow as high as the 100-year flood stage this year is 1 in 100. Statistically, each year begins with the same 1-percent chance that a 100-year...
Does an increase in the 100-year flood estimate originate from climate or land-use change?
Climate variability (dry cycles to wet cycles) and land-use change play a significant role, but there is a large amount of uncertainty around the flood quantile estimates (the value of discharge corresponding to the 100-year flood), particularly if there isn’t a long record of observed data at a stream location. Learn more: The 100-Year Flood The 100-Year Flood--It's All About Chance
How are floods predicted?
Flood predictions require several types of data: The amount of rainfall occurring on a real-time basis. The rate of change in river stage on a real-time basis, which can help indicate the severity and immediacy of the threat. Knowledge about the type of storm producing the moisture, such as duration, intensity and areal extent, which can be valuable for determining possible severity of the...
How can I obtain river forecasts (flood forecasts)?
River forecasts (flood forecasts) are made by the National Weather Service River Forecast Centers and released through local Weather Service Offices. This NOAA website has a map showing the location of the forecast centers, their areas of responsibility, and by clicking into a region the location of the gages they use. The also provide a section for long-range river flood risk. The vast majority...
- Partners
Below are partners associated with flood information.