An official website of the United States government
Here's how you know
Official websites use .gov
A .gov website belongs to an official government organization in the United States.
Secure .gov websites use HTTPS
A lock () or https:// means you’ve safely connected to the .gov website. Share sensitive information only on official, secure websites.
Data scientists in the USGS Water Resources Mission Area make sense of large environmental and operational datasets by applying various modeling, statistical, and visualization techniques to generate actionable information.
Technological advances are driving exponential growth in data, improving the efficiency of many sectors and disrupting others. Extracting meaningful information quickly from the modern-day deluge of data is now a requirement for being successful. However, generating decision-ready data or predicting future outcomes from environmental or operational data is challenging and requires specialized skills. Research teams can tap into big data insights through the inclusion of data scientists — individuals with interdisciplinary backgrounds that include data analysis, statistics, data visualization, computer science, and mathematics.
At the USGS, water data science is focused on the following:
Modeling: Combine theory-based models with powerful empirical predictive tools (e.g., deep learning)
Data pipelines: Build efficiency through reproducible and collaborative data workflows
Data visualizations: Share insights with innovative and thoughtful visualizations
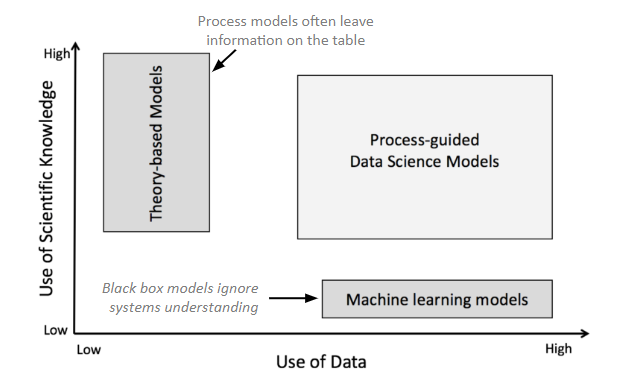
USGS has a rich history in the development and application of process-based models. These models are formulated based on known environmental relationships and are the de facto tool for water resources predictions. Alternatively, new deep learning (DL; a subset of machine learning) tools deliver improved prediction accuracy by resolving complex relationships in large quantities of data, and have great potential to aid scientific discovery for water resources. Theory-Guided Data Science modeling (figure 1; Karpatne et al. 2017) integrates process understanding into advanced machine learning modeling techniques. Data science collaborations with computer scientists at the University of Minnesota (V Kumar) and Virginia Tech (A Karpatne) are building and testing these hybrid modeling frameworks on water predictions.
Figure 1. A new paradigm for scientific discovery that combines theory with data science models was introduced by Karpatne et al. 2017.
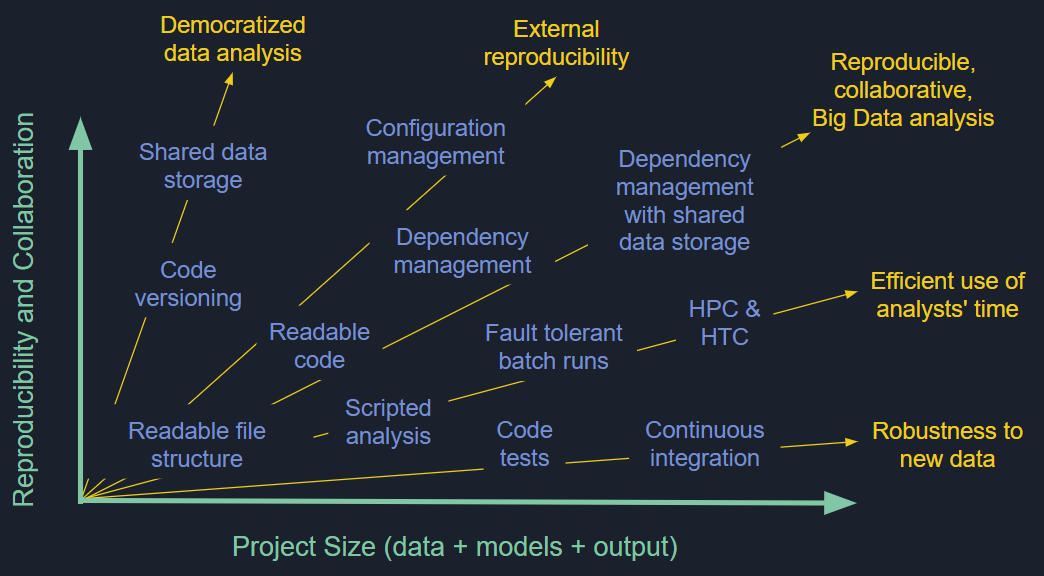
In addition to new modeling development, there is a growing emphasis on interdisciplinary research that necessitates integration of large, disparate datasets. Scientific workflows and computing methods must continually evolve to meet these challenges; however, current techniques for accessing and using data are not sufficient. Data scientists at the USGS develop and build tools that enable reproducible and collaborative data workflows (figure 2) and collaborate on research projects to assist on the challenges of data integration.
Figure 2. Data science tools and techniques to build and execute data workflows for modeling and complex data analyses.
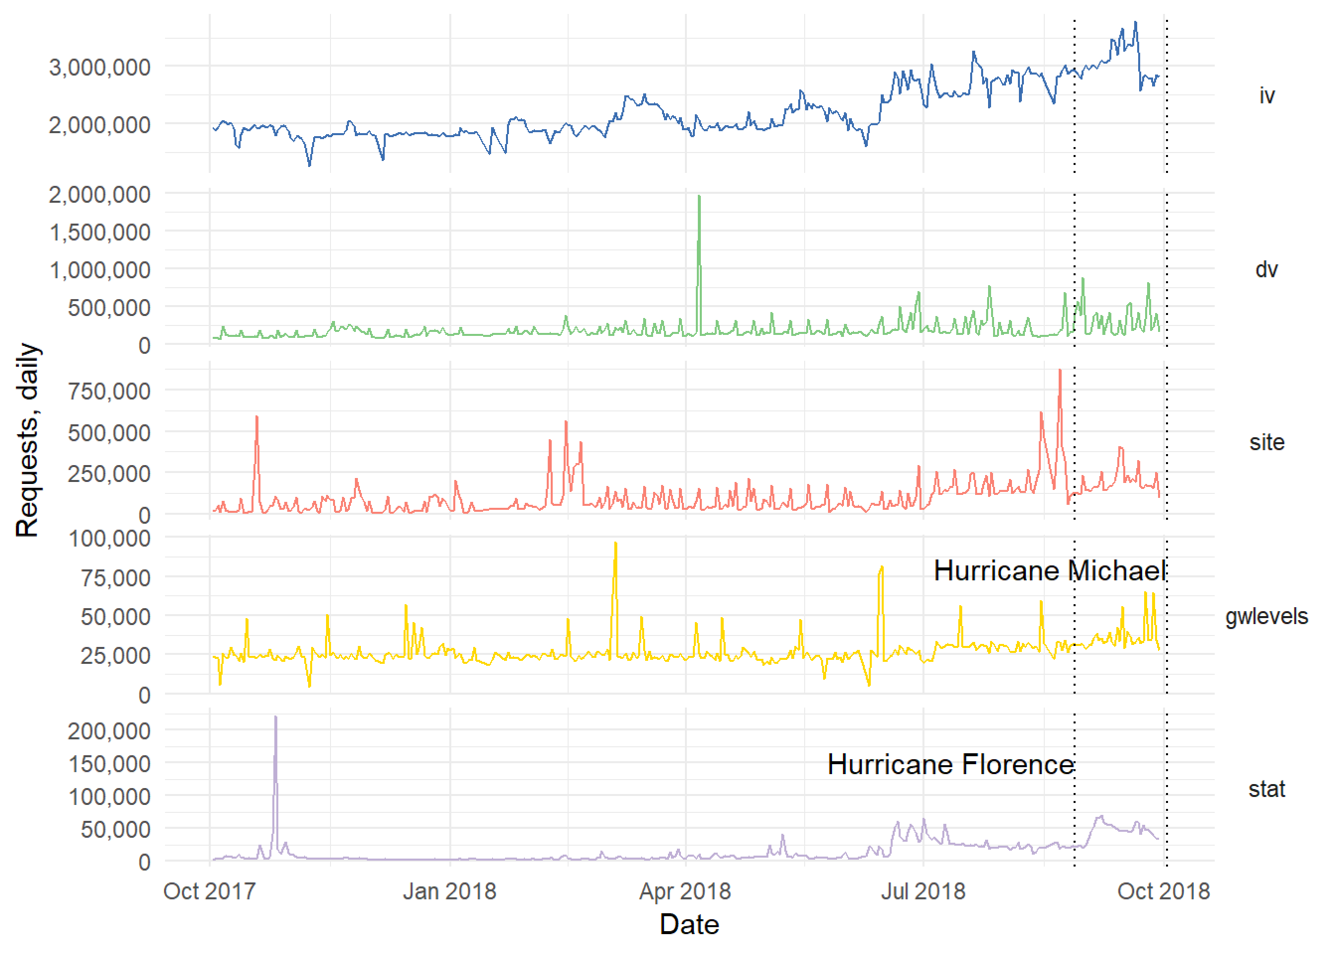
Beyond traditional scientific research, operational data and web analytics are important applications of data science in the USGS WMA. The primary platform for communicating with stakeholders, taxpayers, and Congress is the Web. Web products can be improved based on learning more about user behavior and user needs by capturing and analyzing website interactions. Data scientists are applying data science methods to operational data (figure 3) to help optimize web product development and improve the likelihood that stakeholders will find and use our products.
Figure 3. Number of requests to the National Water Information System by data service in FY18 (October 1, 2017 to September 30, 2018).
Data visualization is a valuable tool for making high-volume, complex data accessible to stakeholders, policy makers, and managers to facilitate data-driven conversations about environmental issues. While scientists are adept at creating graphs and figures that display scientific data and results, data science can strengthen scientific visual products and expand their reach to more diverse audiences (figure 4). See examples of USGS data visualizations here.
Executive Summary Traditionally in the USGS, data is processed and analyzed on local researcher computers, then moved to centralized, remote computers for preservation and publishing (ScienceBase, Pubs Warehouse). This approach requires each researcher to have the necessary hardware and software for processing and analysis, and also to bring all external data required for the workflow...
Exploring the USGS Science Data Life Cycle in the Cloud
Executive Summary Traditionally in the USGS, data is processed and analyzed on local researcher computers, then moved to centralized, remote computers for preservation and publishing (ScienceBase, Pubs Warehouse). This approach requires each researcher to have the necessary hardware and software for processing and analysis, and also to bring all external data required for the workflow over the
USGS scientists often face computationally intensive tasks that require high-throughput computing capabilities. Several USGS facilities use HTCondor to run their computational pools but are not necessarily connected to the larger USGS pool. This project demonstrated how to connect HTCondor pools by flocking, or coordinating, within the USGS. In addition to flocking the Upper Midwest...
Flocks of a feather dock together: Using Docker and HTCondor to link high-throughput computing across the USGS
USGS scientists often face computationally intensive tasks that require high-throughput computing capabilities. Several USGS facilities use HTCondor to run their computational pools but are not necessarily connected to the larger USGS pool. This project demonstrated how to connect HTCondor pools by flocking, or coordinating, within the USGS. In addition to flocking the Upper Midwest Environmental
The National Water Information System (NWIS) web application provides access to real-time and historical surface-water, groundwater, water-quality, and water-use data collected at approximately 1.5 million sites across all 50 states.
Late fall 2019 water availability data viz (IWAAs concept map)
This animation highlights the USGS Integrated Water Availability Assessments (IWAAs) Program’s evolving capacity to estimate water availability at a national scale by visualizing daily estimates of natural water storage (water present on the landscape such as standing water, snowpack, soil water, and shallow groundwater) for approximately 110,000 regions across the
This animation highlights the USGS Integrated Water Availability Assessments (IWAAs) Program’s evolving capacity to estimate water availability at a national scale by visualizing daily estimates of natural water storage (water present on the landscape such as standing water, snowpack, soil water, and shallow groundwater) for approximately 110,000 regions across the
Data visualization pulling together multiple datasets from multiple agencies to explain how rain and flooding from Hurricane Florence impacted the landscape.
Data visualization pulling together multiple datasets from multiple agencies to explain how rain and flooding from Hurricane Florence impacted the landscape.
A national-scale quantification of metabolic energy flow in streams and rivers can improve understanding of the temporal dynamics of in-stream activity, links between energy cycling and ecosystem services, and the effects of human activities on aquatic metabolism. The two dominant terms in aquatic metabolism, gross primary production (GPP) and aerobic respiration (ER), have recently...
Authors
Alison P. Appling, Jordan S. Read, Luke A. Winslow, Maite Arroita, Emily S. Bernhardt, Natalie A. Griffiths, Robert O. Hall, Judson W. Harvey, James B. Heffernan, Emily H. Stanley, Edward G. Stets, Charles B. Yackulic
Aquatic systems are critical to food, security, and society. But, water data are collected by hundreds of research groups and organizations, many of which use nonstandard or inconsistent data descriptions and dissemination, and disparities across different types of water observation systems represent a major challenge for freshwater research. To address this issue, the Water Quality...
Authors
Emily K. Read, Lindsay Carr, Laura A. DeCicco, Hilary Dugan, Paul C. Hanson, Julia A. Hart, James Kreft, Jordan S. Read, Luke Winslow
The Water Quality Portal integrates and provides access to publicly available water-quality data from databases such as USGS NWIS and BioData, EPA STORET, and USDA-ARS STEWARDS through a single search interface.
Hurricane Maria made landfall in Puerto Rico on September 20, 2017, bringing with it a mix of high winds and extreme rainfall. This data visualization animates Hurricane Maria's Water Footprint, the cumulative precipitation the storm dropped on the island, and the impact of rainfall on river gage height.
Hurricane Irma, the most intense hurricane observed in the Atlantic in the last decade, approached the west coast of Florida on September 10th, 2017. This Hurricane Irma Water Footprint data visualization animates the hurricane's path, cumulative precipitation, and its impact on river gage height.
Hurricane Harvey approached the U.S. Gulf coast on August 25, 2017. The Hurricane Harvey Water Footprint data visualization shows the hurricane's impact on precipitation and streamflow.
Hurricane Matthew approached the southeastern U.S. coast on October 7, 2016. This is a data visualization that shows the hurricane's impact on precipitation and streamflow.
Microplastics, plastic particles less than 5 millimeters in diameter, are a contaminant of emerging concern in aquatic environments. This interactive visualization explores classifications and potential sources of microplastics in the Great Lakes.
Since 2000, the Colorado River Basin has been experiencing a historic, extended drought that has impacted regional water supply and other resources, such as hydropower, recreation, and ecologic services. This visualization is part of a multi-agency effort to showcase the usefulness of open data by exploring the current 16-year drought and its effects on the Colorado River Basin.
In 2017, the State of California was experiencing one of the most severe droughts on record, which has implications for citizens of California and beyond. This website graphically visualizes these data to help understand the effect of drought on rivers, streams, lakes, and reservoirs.
Data scientists in the USGS Water Resources Mission Area make sense of large environmental and operational datasets by applying various modeling, statistical, and visualization techniques to generate actionable information.
Technological advances are driving exponential growth in data, improving the efficiency of many sectors and disrupting others. Extracting meaningful information quickly from the modern-day deluge of data is now a requirement for being successful. However, generating decision-ready data or predicting future outcomes from environmental or operational data is challenging and requires specialized skills. Research teams can tap into big data insights through the inclusion of data scientists — individuals with interdisciplinary backgrounds that include data analysis, statistics, data visualization, computer science, and mathematics.
At the USGS, water data science is focused on the following:
Modeling: Combine theory-based models with powerful empirical predictive tools (e.g., deep learning)
Data pipelines: Build efficiency through reproducible and collaborative data workflows
Data visualizations: Share insights with innovative and thoughtful visualizations
USGS has a rich history in the development and application of process-based models. These models are formulated based on known environmental relationships and are the de facto tool for water resources predictions. Alternatively, new deep learning (DL; a subset of machine learning) tools deliver improved prediction accuracy by resolving complex relationships in large quantities of data, and have great potential to aid scientific discovery for water resources. Theory-Guided Data Science modeling (figure 1; Karpatne et al. 2017) integrates process understanding into advanced machine learning modeling techniques. Data science collaborations with computer scientists at the University of Minnesota (V Kumar) and Virginia Tech (A Karpatne) are building and testing these hybrid modeling frameworks on water predictions.
Figure 1. A new paradigm for scientific discovery that combines theory with data science models was introduced by Karpatne et al. 2017.
In addition to new modeling development, there is a growing emphasis on interdisciplinary research that necessitates integration of large, disparate datasets. Scientific workflows and computing methods must continually evolve to meet these challenges; however, current techniques for accessing and using data are not sufficient. Data scientists at the USGS develop and build tools that enable reproducible and collaborative data workflows (figure 2) and collaborate on research projects to assist on the challenges of data integration.
Figure 2. Data science tools and techniques to build and execute data workflows for modeling and complex data analyses.
Beyond traditional scientific research, operational data and web analytics are important applications of data science in the USGS WMA. The primary platform for communicating with stakeholders, taxpayers, and Congress is the Web. Web products can be improved based on learning more about user behavior and user needs by capturing and analyzing website interactions. Data scientists are applying data science methods to operational data (figure 3) to help optimize web product development and improve the likelihood that stakeholders will find and use our products.
Figure 3. Number of requests to the National Water Information System by data service in FY18 (October 1, 2017 to September 30, 2018).
Data visualization is a valuable tool for making high-volume, complex data accessible to stakeholders, policy makers, and managers to facilitate data-driven conversations about environmental issues. While scientists are adept at creating graphs and figures that display scientific data and results, data science can strengthen scientific visual products and expand their reach to more diverse audiences (figure 4). See examples of USGS data visualizations here.
Executive Summary Traditionally in the USGS, data is processed and analyzed on local researcher computers, then moved to centralized, remote computers for preservation and publishing (ScienceBase, Pubs Warehouse). This approach requires each researcher to have the necessary hardware and software for processing and analysis, and also to bring all external data required for the workflow...
Exploring the USGS Science Data Life Cycle in the Cloud
Executive Summary Traditionally in the USGS, data is processed and analyzed on local researcher computers, then moved to centralized, remote computers for preservation and publishing (ScienceBase, Pubs Warehouse). This approach requires each researcher to have the necessary hardware and software for processing and analysis, and also to bring all external data required for the workflow over the
USGS scientists often face computationally intensive tasks that require high-throughput computing capabilities. Several USGS facilities use HTCondor to run their computational pools but are not necessarily connected to the larger USGS pool. This project demonstrated how to connect HTCondor pools by flocking, or coordinating, within the USGS. In addition to flocking the Upper Midwest...
Flocks of a feather dock together: Using Docker and HTCondor to link high-throughput computing across the USGS
USGS scientists often face computationally intensive tasks that require high-throughput computing capabilities. Several USGS facilities use HTCondor to run their computational pools but are not necessarily connected to the larger USGS pool. This project demonstrated how to connect HTCondor pools by flocking, or coordinating, within the USGS. In addition to flocking the Upper Midwest Environmental
The National Water Information System (NWIS) web application provides access to real-time and historical surface-water, groundwater, water-quality, and water-use data collected at approximately 1.5 million sites across all 50 states.
Late fall 2019 water availability data viz (IWAAs concept map)
This animation highlights the USGS Integrated Water Availability Assessments (IWAAs) Program’s evolving capacity to estimate water availability at a national scale by visualizing daily estimates of natural water storage (water present on the landscape such as standing water, snowpack, soil water, and shallow groundwater) for approximately 110,000 regions across the
This animation highlights the USGS Integrated Water Availability Assessments (IWAAs) Program’s evolving capacity to estimate water availability at a national scale by visualizing daily estimates of natural water storage (water present on the landscape such as standing water, snowpack, soil water, and shallow groundwater) for approximately 110,000 regions across the
Data visualization pulling together multiple datasets from multiple agencies to explain how rain and flooding from Hurricane Florence impacted the landscape.
Data visualization pulling together multiple datasets from multiple agencies to explain how rain and flooding from Hurricane Florence impacted the landscape.
A national-scale quantification of metabolic energy flow in streams and rivers can improve understanding of the temporal dynamics of in-stream activity, links between energy cycling and ecosystem services, and the effects of human activities on aquatic metabolism. The two dominant terms in aquatic metabolism, gross primary production (GPP) and aerobic respiration (ER), have recently...
Authors
Alison P. Appling, Jordan S. Read, Luke A. Winslow, Maite Arroita, Emily S. Bernhardt, Natalie A. Griffiths, Robert O. Hall, Judson W. Harvey, James B. Heffernan, Emily H. Stanley, Edward G. Stets, Charles B. Yackulic
Aquatic systems are critical to food, security, and society. But, water data are collected by hundreds of research groups and organizations, many of which use nonstandard or inconsistent data descriptions and dissemination, and disparities across different types of water observation systems represent a major challenge for freshwater research. To address this issue, the Water Quality...
Authors
Emily K. Read, Lindsay Carr, Laura A. DeCicco, Hilary Dugan, Paul C. Hanson, Julia A. Hart, James Kreft, Jordan S. Read, Luke Winslow
The Water Quality Portal integrates and provides access to publicly available water-quality data from databases such as USGS NWIS and BioData, EPA STORET, and USDA-ARS STEWARDS through a single search interface.
Hurricane Maria made landfall in Puerto Rico on September 20, 2017, bringing with it a mix of high winds and extreme rainfall. This data visualization animates Hurricane Maria's Water Footprint, the cumulative precipitation the storm dropped on the island, and the impact of rainfall on river gage height.
Hurricane Irma, the most intense hurricane observed in the Atlantic in the last decade, approached the west coast of Florida on September 10th, 2017. This Hurricane Irma Water Footprint data visualization animates the hurricane's path, cumulative precipitation, and its impact on river gage height.
Hurricane Harvey approached the U.S. Gulf coast on August 25, 2017. The Hurricane Harvey Water Footprint data visualization shows the hurricane's impact on precipitation and streamflow.
Hurricane Matthew approached the southeastern U.S. coast on October 7, 2016. This is a data visualization that shows the hurricane's impact on precipitation and streamflow.
Microplastics, plastic particles less than 5 millimeters in diameter, are a contaminant of emerging concern in aquatic environments. This interactive visualization explores classifications and potential sources of microplastics in the Great Lakes.
Since 2000, the Colorado River Basin has been experiencing a historic, extended drought that has impacted regional water supply and other resources, such as hydropower, recreation, and ecologic services. This visualization is part of a multi-agency effort to showcase the usefulness of open data by exploring the current 16-year drought and its effects on the Colorado River Basin.
In 2017, the State of California was experiencing one of the most severe droughts on record, which has implications for citizens of California and beyond. This website graphically visualizes these data to help understand the effect of drought on rivers, streams, lakes, and reservoirs.