
Landsat 9 OLI and TIRS Calibration Notices
This page displays the Landsat 9 Operational Land Imager (OLI) and Thermal Infrared Sensor (TIRS) instrument calibration notices.
April 2026 - Landsat 9 Held During October 2025 Safehold Processed
March 2023 - Landsat 9 Reprocessing Event
March 2022 - Updated Calibration Parameters
April 2026 - Landsat 9 Held During October 2025 Safehold Processed
Landsat 9 data acquired following an October 2025 safehold event were recently processed into Landsat Level-1 and Level-2 products. Additionally, a small number of Landsat products processed just prior and just after the safehold were also reprocessed.
In October 2025, Landsat 9’s sensors—the Operational Land Imager and Thermal Infrared Sensor—did not acquire data from midday October 17 (DOY 290) to midday October 22 (DOY 295) due to the spacecraft entering a safehold.
After the safehold ended, imaging resumed. The data acquired between 11:47 a.m. CDT on October 22 to 2:43 p.m. CDT on October 24 were held and not processed into products so the USGS-NASA Calibration/Validation Team could verify the data’s integrity.
This animation shows how updated calibration coefficients improved Landsat 9 Band 7 imagery acquired shortly after the October 2025 safehold ended.
Following their analysis, the team applied updated radiometric and geometric calibration coefficients to the data and generated 1,585 new Level-1 products, which are now available for download. The follow-on generation of Landsat Level-2, Landsat U.S. Analysis Ready Data (ARD), and Level-3 science products are in process.
In addition to the newly processed products, 42 Level-1 products from October 17, and 13 products from October 24, were reprocessed with updated radiometric correction parameters. Newly generated Level-1 and Level-2 products have replaced those already visible on EarthExplorer (EE) and other USGS data access sources. Landsat U.S. Analysis Ready Data (ARD) and Level-3 products will also be regenerated in the near future.
Access the April 6, 2026 News webpage describing this processing/reprocessing effort.
March 1, 2023 - Landsat 9 Reprocessing Event
The USGS Landsat Project will begin reprocessing of the Landsat 9 Collection 2 Operational Land Imager (OLI) and Thermal Infrared Sensor (TIRS) data from the first year of operations beginning March 1, 2023, to take advantage of calibration updates identified by the USGS/NASA Calibration and Validation team. The original image data will be replaced in the archive with the reprocessed imagery. Reprocessing is expected to take approximately 6-8 weeks.
Listed below are the updates being applied to the data and potential impacts these changes may have on use of the data. Users are encouraged to assess these improvements and impacts against their science work and applications to determine if their Landsat 9 data should be replaced with the updated data. Please note, the Product ID contains the most recent processing date and that will facilitate identification of scenes included in this reprocessing effort. All reprocessed imagery will have a processing date that is March 1, 2023 or later.
Calibration Updates Affecting OLI
OLI Sensor Chip Assembly (SCA) Relative Gains (Banding)
This update reduces the visible banding between the 14 focal plane modules in the SWIR-2 spectral band (Band 7) of Landsat 9's OLI over bright targets (Figure 1). This banding was corrected in imagery processed after March 8, 2022, and this current reprocessing effort will correct the remaining imagery processed prior to March 8, 2022.
OLI Cross-Calibration (Reflectance and Radiance)
Cross-calibration between the OLI sensors on Landsat 9 and Landsat 8 was performed using data collected during the November 2021 underfly activity. After the initial cross-calibration during Landsat 9 commissioning, the analysis was refined during the first year of operations, and updated calibration parameters improve the consistency of Landsat 8 and Landsat 9. This update provides a modest correction to all Landsat 9 OLI bands, with largest improvements of ~0.5 percent in Green spectral band (Band 3) reflectance and ~5 percent in Cirrus spectral band (Band 9) radiance (Table 1).
| Band | Reflectance Mean | Radiance Mean |
|---|---|---|
| Band 1 | 1.001 | 0.999 |
| Band 2 | 1.002 | 1.000 |
| Band 3 | 0.996 | 0.9978 |
| Band 4 | 1.000 | 0.996 |
| Band 5 | 1.001 | 0.996 |
| Band 6 | 1.003 | 0.9923 |
| Band 7 | 1.002 | 0.990 |
| Band 8 | 0.999 | 0.9962 |
| Band 9 | 1.0077 | 0.945 |
Calibration Updates Affecting TIRS
TIRS Absolute Bias (Radiance)
Updates were made to TIRS absolute radiance, which affects top of atmosphere, brightness temperature, and surface temperature. Throughout the first year of Landsat 9 operations, comparisons between Landsat 9 products and NASA JPL and NOAA buoy-data showed the need to update absolute thermal calibration (Figure 2). This update ties Landsat 9 calibration to the same reference as Landsat 8. Prior to this update Landsat 9 absolute thermal calibration was tied to pre-launch laboratory measurements. The amount of effect is variable across different measured temperatures: Figure 3 shows the impact in Kelvin at various temperatures.


TIRS Detector Swaps/Relative Gains (Striping)
Sixteen detectors in Band 10 and three detectors in Band 11 were replaced with their redundant detectors to reduce striping due to changes in responsivity. The resulting stripes could appear at any time and could not be adequately corrected for with quarterly calibration updates. The detector swap will result in more stable detectors being used to generate the Level-1 and Level-2 image products and should result in a lower level of striping across Bands 10 and 11.

Improvements to Systematic Terrain (L1GT) scenes
An along track alignment adjustment of the OLI instrument improves L1GT accuracy by up to 20 meters. Although all L1GT products benefit, the greatest improvement is observed in areas where L1GT are the only products ever created (i.e., in areas where little or no ground control exits). (Figure 5, Table 2). All scenes over Antarctica will be improved, along with several islands, Greenland, and coastal images made up largely of water. Figure 6 shows an example of the improvement.

| Path/Row Type | Description | Number of L1GT Scenes |
|---|---|---|
| Antarctica | WRS Rows 101 to 133 | 32,930 |
| Greenland | 100% Land, Rows 2-15 | 2,081 |
| Island/Coastal Sliver | Between 0.001% to 0.94% Land | 583 |
| Open Ocean | 0% Land, Rows 1-100, 247-248 | 8,204 |
| Night/Ascending | No Percent Land Available |
6,148 |
The magnitude of the change associated with the Sensor Alignment calibration can be seen in the Geodetic Accuracy pre-fit means results where the term pre-fit refers the measured offset between the reference imagery and the Landsat product prior to ground control being applied to the imagery. These results are shown in Figure 7 where each geometric calibration site is shown along with a moving average (MA) of that data to better demonstrate the changes over time that is occurring with respect to the sensor alignment parameters.


TIRS to OLI Alignment
Adjustment will improve TIRS to OLI co-instrument alignment for all scenes in the archive (Figure 8).

Science and Application User Impacts
A select number of Landsat 9 scenes were selected to quantify the impact of calibration updates on Landsat 9 Level-2 products. This included 25 globally distributed scenes to capture extreme atmospheric conditions and different land cover types and a stack of 22 scenes over Path39/Row37 (Southwestern United States) for time series analysis. Figure 9 shows the geographic distribution of the Landsat 9 scenes used for impact assessment.

The overall impact of calibration updates on the atmospherically compensated Level-2 Surface Reflectance and Surface Temperature products is minor. The magnitude of the change in Level-2 products is within the uncertainty range of atmospheric correction algorithms. The enhancements in Visible to Short Wave Infrared (VSWIR) banding and Thermal Infrared (TIR) striping artifacts described for the Level-1 also apply for the Level-2 science products. The following sections provide a more detailed description of the change in Level-2 Surface Reflectance and Surface Temperature products.
Summary of VSWIR Bands Changes
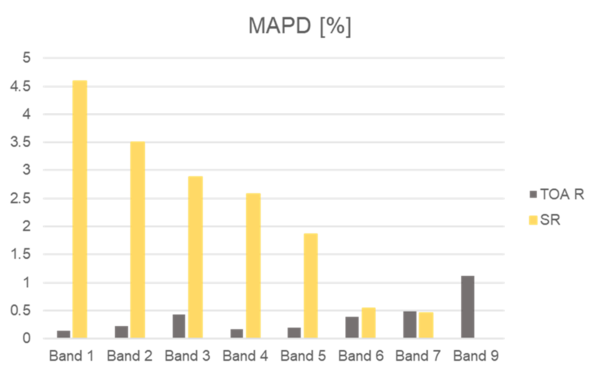
The change in Level-2 Surface Reflectance for the VSWIR spectral bands was minimal and well-correlated with the Level-1 Top of Atmosphere (TOA) reflectance changes. Figure 10 summarizes the Mean Absolute Difference (MAD) for the Level-1 TOA (grey bars) Reflectance and Level-2 Surface Reflectance (yellow bars). As expected, the operational Land Surface Reflectance Code (LaSRC) algorithm used for atmospheric correction introduces larger differences in the Level-2 Surface Reflectance product compared to Level-1. On average, the Green spectral band (Band 3) shows largest Surface Reflectance difference (0.0013) followed by the SWIR1 (0.0010) and SWIR2 (0.0009). The Level-1 TOA Reflectance change was minimum for the Cirrus spectral band (8.2e-5 units of reflectance; Band 9).
Figure 11 shows the relative change in TOA and Surface Reflectance using the Mean Absolute Percent Difference (MAPD) statistic. Due to its low dynamic range, the small reflectance changes in the Cirrus band (8.2e-5)(Band 9) can translate to relatively large (~1.1 percent) MAPD in Level-1 TOA Reflectance.
Relative change in Level-2 Surface Reflectance is mainly controlled by the approximation of aerosol path radiance. The Aerosol Optical Thickness (AOT) in the operational LaSRC algorithm is estimated using the ratio between the Red (Band 4), Blue (Band 2), and Coastal Aerosol (Band 1) spectral bands. The path radiance decreases with wavelength. Therefore, shorter wavelengths are expected to be relatively more sensitive to any Level-1 radiometric variation. The Coastal Aerosol spectral band has highest relative sensitivity (MAPD of 4.6 percent) in Level-2 Surface Reflectance among the VSWIR spectral bands.
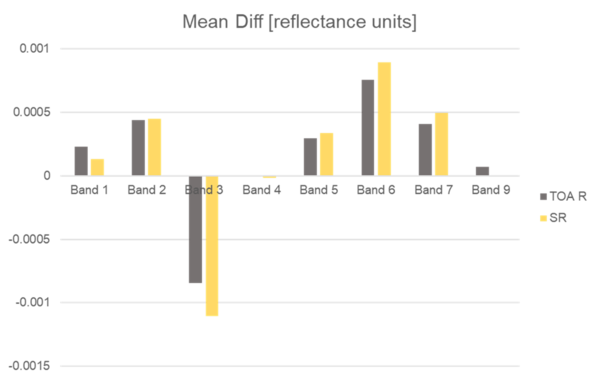
As indicated in cross-calibration table (Table 1), most VSWIR spectral bands are expected to show slightly brighter reflectance values on average after applying the calibration updates. The Mean Difference in Figure 12 below illustrates a slight increase in reflectance of most VSWIR spectral bands. The Green spectral band (Band 3) will be slightly darker (decreased reflectance), while the Red spectral band (Band 4) is almost unchanged on average.

The left panel in Figure 13 shows the Surface Reflectance difference for SWIR2 (Band 7) as a result of calibration updates. The SCA bandings in the difference image are due to enhancements in the relative gain. The scatterplot on the right panel shows the strong overall agreement between the Surface Reflectance before and after the reprocessing.

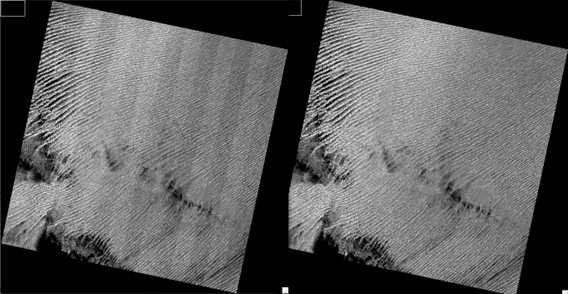
Figure 14 shows an example of on-demand Level-2 Aquatic Reflectance Band 1 (Coastal Aerosol) generated for a pair of scenes acquired during the Landsat 8/Landsat 9 underfly in November 2021. The reprocessed Landsat 9 image (right image) reveals less SCA Banding compared to the original image (middle).

Summary of Thermal Band Changes

The overall impact of the calibration updates on the TOA Brightness Temperature at Band 10 and the Level-2 Single Channel Surface Temperature product calculated using this band is negligible. Figure 15 shows that the Mean Absolute Difference for ST Band 10 is 0.06 Kelvin for the test scenes. This is well within the range of Level-2 Surface Temperature uncertainty.
TIRS Band 11 is expected to change more significantly compared to Band 10. The Mean Absolute Difference for the Top of Atmosphere Brightness Temperature at Band 11 is ~0.37 Kelvin for the studied scenes. The boxplot of difference in Figure 16 illustrates that all studies scenes will have a greater Brightness Temperature after applying the calibration updates.

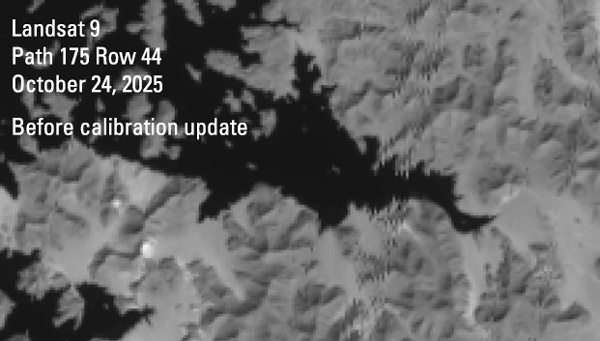
Figure 17 shows an example of a Level-2 Surface Temperature product generated by applying the single channel algorithm on Band 10. The striping artifacts over the water body are clearly improved after applying the calibration updates.

Changes in Quality Assessment Layer
The impact on Pixel Quality Assessment (QA_PIXEL) generated using the C Function of Mask (CFMask) algorithm is very minor. The total difference in QA_PIXEL is less than 3.0 percent for the studied scenes. This difference is less than 0.3 percent and 0.5 percent for the Cirrus and Snow bits, respectively.
March 8, 2022 - Updated Calibration Parameters
The USGS and NASA Calibration/Validation team updated the Landsat 9 calibration parameters on March 8, 2022. These updates reduced banding between the 14 focal plane modules visible in the SWIR-2 band (Band 7) of Landsat 9's Operational Land Imager. The update was not applied to Landsat 9 images acquired before March 8, 2022.
NOTE: These updates do not affect the absolute calibration or cross-calibration between Landsat 9 and Landsat 8.
