ECOSTRESS, or ECOsystem Spaceborne Thermal Radiometer Experiment on Space Station, data provides variables related to plant water stress, including evapotranspiration, evaporative stress index and water use efficiency. The NASA Land Processes Distributed Active Archive Center (LP DAAC) at EROS provides storage and distribution of ECOSTRESS data.
California and Landsat
See California from Space
Use the links below to explore more Landsat resources highlighting California.
Detailed Description
California has remarkable geographic diversity, from 1,100 miles of Pacific shoreline to 33 million acres of trees, including its famous redwood forests along the Pacific Coast Highway, U.S. Route 101. And although California’s nickname is “The Golden State," it may also deserve the title of “The Extreme State.” Mount Whitney, the highest peak in the conterminous United States, stands at 14,494 feet above sea level in the Sierra Nevada mountain range. Just 2.5 hours away by car, Death Valley’s Badwater Basin boasts the lowest point in the United States: 282 feet below sea level. Although hundreds of inches of snow fall on Mount Whitney each year, the rainfall in Death Valley, commonly called the hottest place on Earth, averages less than 2 inches.
California is the most populous U.S. State with 39 million residents, 26 million of whom live near the coast. It’s also the most agriculturally productive State, raising a variety of fruits, vegetables, nuts, grains, grasses, and flowers in addition to dairy and livestock. Although climate change affects many of these people, production, and places, Landsat can help agencies and residents monitor their landscapes and plan for a resilient future.
Visit Landsat Benefits, State By State to learn more about how Landsat brings science to your state.
Sources/Usage
Public Domain.
Related
Image of the Week - Fires Across California
Fires burned across California in late 2019. Fall is the state's most dangerous season for wildfires, propelled by dry and windy conditions. In recent years however, the fall fire season has been starting earlier and ending later. A series of images from the MODIS sensor on NASA's Terra and Aqua satellites show the Kincade Fire in northern California.
ECOSTRESS, or ECOsystem Spaceborne Thermal Radiometer Experiment on Space Station, data provides variables related to plant water stress, including evapotranspiration, evaporative stress index and water use efficiency. The NASA Land Processes Distributed Active Archive Center (LP DAAC) at EROS provides storage and distribution of ECOSTRESS data.
ECOSTRESS, which stands for the ECOsystem Spaceborne Thermal Radiometer Experiment on Space Station, collects land surface temperatures in an effort to answer questions about plants’ use of water. The NASA Land Processes Distributed Active Archive Center (LP DAAC) at EROS has provided storage and distribution of ECOSTRESS data for four years now and counting.
We don't need a scientist to tell us that city streets catch and hold heat. Anyone who's walked barefoot from a parking lot to a beach can tell you that. What scientists can help us understand, particularly scientists who work with spaceborne, remotely sensed data, is just how big a difference there is between cities and the countryside.
Spaceborne sensors orbit hundreds of miles over our heads. Even the most advanced among them struggle to capture high-resolution imagery of individual human beings. Mosquitos, of course, are far smaller than we are. Clearly, sensors on a satellite or space station can’t see them.
In this episode of Eyes on Earth, we zero in on the use of USGS Land Change Monitoring, Assessment, and Projection (LCMAP) products to examine the effects of drought on California’s Blue Oaks. LCMAP datasets are built from Landsat data and reveal the land cover and change of every pixel in the conterminous United States, dating back to 1985.
Summary: The Earth observation data archived here have plenty of value to the study of aquatic ecosystems. Landsat satellites can capture harmful algal blooms, for example. Spaceborne sensors can also record land surface temperatures, and that includes water surfaces.
This natural color Landsat 9 image from December 10, 2021 shows the cities of San Francisco, San Jose, and Oakland surrounding the San Francisco Bay. The bay is the largest estuary on the west coast and includes a patchwork of mud flats, salt marshes, and salt ponds.
The Caldor fire in California started on August 14, 2021 and quickly spread in high winds.
The fire continues to expand toward the Lake Tahoe area as residents evacuate.
This image was captured on August 21, the 8th day.
Landsat 8's near infrared and shortwave infrared bands reveal active fire, burn scars, and smoke.
Landsat's thermal and infrared bands also expose the Caldor fire's advancing edge at night time. This image is from August 29, 201, 15 days after ignition.
The Dixie Fire has become the largest single fire in California's recorded history. State fire officials don't list it at the top, however. The record is held by the massive August Complex fire of 2020 which burned over one million acres. The term "complex" is used when multiple fires in the same area ignite separately.
The Caldor Fire in California started on August 14, 2021 and quickly spread in high winds. The fire expanded toward the Lake Tahoe area as residents evacuated. Landsat image was captured on August 21, the 8th day. Landsat 8's near-infrared and shortwave infrared bands reveal active fire, burn scars, and smoke.
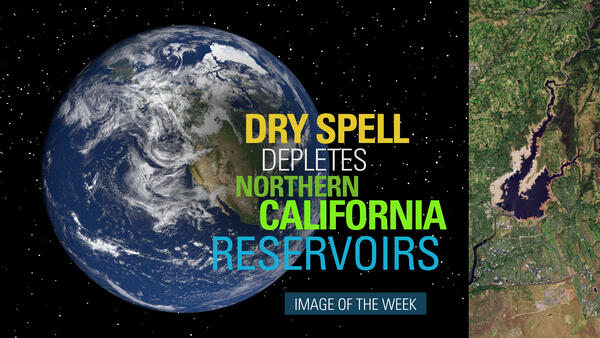
A prolonged dry spell has sparked woes over water availability and wildfire in the western United States.
A mudslide near the 2020 Dolan Fire's ignition point chopped through a chunk of California's scenic State Highway 1 in late January.
The Dolan Fire began near Big Sur on August 18th, 2020. It scarred nearly 125,000 acres before being fully contained in December.
A mudslide near the 2020 Dolan Fire's ignition point chopped through a chunk of California's scenic State Highway 1 in late January.
The Dolan Fire began near Big Sur on August 18th, 2020. It scarred nearly 125,000 acres before being fully contained in December.
As fire season continues in the western United States let's look back at a number of incidents tracked by officials across California in August. These fires were captured during the day by Landsats 7 and 8, in natural color bands of the visible spectrum. Landsat sensors also record infrared wavelengths revealing burn scars and active fires.
Satellite imagery shows the rupture and shifting of land near Ridgecrest, CA from the July 2019 earthquakes.
Satellites have captured views of the numerous major fires burning in California.
An image acquired on November 9, 2018, from NASA’s MODIS sensor on the Terra satellite shows smoke pouring out of two major fires, the Camp Fire and the Woolsey Fire, which both ignited the day before.
Satellites have captured views of the numerous major fires burning in California.
An image acquired on November 9, 2018, from NASA’s MODIS sensor on the Terra satellite shows smoke pouring out of two major fires, the Camp Fire and the Woolsey Fire, which both ignited the day before.
Landsat 8 captured satellite views of California’s largest wildfire on record in the summer of 2018. The Mendocino Complex Fire in northern California is a combination of two fires: the Ranch Fire and the River Fire.
Landsat 8 captured satellite views of California's largest wildfire on record in the summer of 2018. The Mendocino Complex fire in northern California is a combination of two fires: the Ranch Fire and the River Fire.
After a month, the wildfires of Southern California are nearly contained. Landsat 8 imagery shows the dramatic burn scars left behind.
At the USGS EROS Center, we study land change, operate the Landsat satellites, and maintain the longest, continuously acquired collection of images of the Earth's land surface.
In the Landsat 8 image acquired on December 9, smoke is carried west by strong winds, which also continued to spread fire through the dry terrain, mountain passes, and canyons. The diagonal lines are an airplane contrail and its shadow cast on the ground.
The Thomas fire has burned more than 230,000 acres and continues to blaze across souther California. These images show some of the burn scar left behind.
At the USGS EROS Center, we study land change, operate the Landsat satellites, and maintain the longest, continuously acquired collection of images of the Earth's land surface.
California and Landsat
With EROS Earthshots, travel the world at your own pace and see changes to the Earth's surface in these satellite images of environmental transformation. Start in California with Antelope Valley, San Joaquin Valley, and Imperial Valley.
San Joaquin Valley
Antelope Valley
Imperial Valley
Earthshots
The surface of the Earth is always changing. Some changes like earthquakes, volcanoes, floods, and landslides happen quickly, and other changes, such as most erosional processes, happen slowly over time. It’s often hard to see these changes from ground level. Earthshots shows you how satellite data are used to track these changes over time.
Related
Image of the Week - Fires Across California
Fires burned across California in late 2019. Fall is the state's most dangerous season for wildfires, propelled by dry and windy conditions. In recent years however, the fall fire season has been starting earlier and ending later. A series of images from the MODIS sensor on NASA's Terra and Aqua satellites show the Kincade Fire in northern California.
ECOSTRESS, or ECOsystem Spaceborne Thermal Radiometer Experiment on Space Station, data provides variables related to plant water stress, including evapotranspiration, evaporative stress index and water use efficiency. The NASA Land Processes Distributed Active Archive Center (LP DAAC) at EROS provides storage and distribution of ECOSTRESS data.
ECOSTRESS, which stands for the ECOsystem Spaceborne Thermal Radiometer Experiment on Space Station, collects land surface temperatures in an effort to answer questions about plants’ use of water. The NASA Land Processes Distributed Active Archive Center (LP DAAC) at EROS has provided storage and distribution of ECOSTRESS data for four years now and counting.
We don't need a scientist to tell us that city streets catch and hold heat. Anyone who's walked barefoot from a parking lot to a beach can tell you that. What scientists can help us understand, particularly scientists who work with spaceborne, remotely sensed data, is just how big a difference there is between cities and the countryside.
Spaceborne sensors orbit hundreds of miles over our heads. Even the most advanced among them struggle to capture high-resolution imagery of individual human beings. Mosquitos, of course, are far smaller than we are. Clearly, sensors on a satellite or space station can’t see them.
In this episode of Eyes on Earth, we zero in on the use of USGS Land Change Monitoring, Assessment, and Projection (LCMAP) products to examine the effects of drought on California’s Blue Oaks. LCMAP datasets are built from Landsat data and reveal the land cover and change of every pixel in the conterminous United States, dating back to 1985.
Summary: The Earth observation data archived here have plenty of value to the study of aquatic ecosystems. Landsat satellites can capture harmful algal blooms, for example. Spaceborne sensors can also record land surface temperatures, and that includes water surfaces.
This natural color Landsat 9 image from December 10, 2021 shows the cities of San Francisco, San Jose, and Oakland surrounding the San Francisco Bay. The bay is the largest estuary on the west coast and includes a patchwork of mud flats, salt marshes, and salt ponds.
The Caldor fire in California started on August 14, 2021 and quickly spread in high winds.
The fire continues to expand toward the Lake Tahoe area as residents evacuate.
This image was captured on August 21, the 8th day.
Landsat 8's near infrared and shortwave infrared bands reveal active fire, burn scars, and smoke.
The Caldor fire in California started on August 14, 2021 and quickly spread in high winds.
The fire continues to expand toward the Lake Tahoe area as residents evacuate.
This image was captured on August 21, the 8th day.
Landsat 8's near infrared and shortwave infrared bands reveal active fire, burn scars, and smoke.
Landsat's thermal and infrared bands also expose the Caldor fire's advancing edge at night time. This image is from August 29, 201, 15 days after ignition.
The Dixie Fire has become the largest single fire in California's recorded history. State fire officials don't list it at the top, however. The record is held by the massive August Complex fire of 2020 which burned over one million acres. The term "complex" is used when multiple fires in the same area ignite separately.
The Caldor Fire in California started on August 14, 2021 and quickly spread in high winds. The fire expanded toward the Lake Tahoe area as residents evacuated. Landsat image was captured on August 21, the 8th day. Landsat 8's near-infrared and shortwave infrared bands reveal active fire, burn scars, and smoke.
A prolonged dry spell has sparked woes over water availability and wildfire in the western United States.
A mudslide near the 2020 Dolan Fire's ignition point chopped through a chunk of California's scenic State Highway 1 in late January.
The Dolan Fire began near Big Sur on August 18th, 2020. It scarred nearly 125,000 acres before being fully contained in December.
A mudslide near the 2020 Dolan Fire's ignition point chopped through a chunk of California's scenic State Highway 1 in late January.
The Dolan Fire began near Big Sur on August 18th, 2020. It scarred nearly 125,000 acres before being fully contained in December.
As fire season continues in the western United States let's look back at a number of incidents tracked by officials across California in August. These fires were captured during the day by Landsats 7 and 8, in natural color bands of the visible spectrum. Landsat sensors also record infrared wavelengths revealing burn scars and active fires.
Satellite imagery shows the rupture and shifting of land near Ridgecrest, CA from the July 2019 earthquakes.
Satellites have captured views of the numerous major fires burning in California.
An image acquired on November 9, 2018, from NASA’s MODIS sensor on the Terra satellite shows smoke pouring out of two major fires, the Camp Fire and the Woolsey Fire, which both ignited the day before.
Satellites have captured views of the numerous major fires burning in California.
An image acquired on November 9, 2018, from NASA’s MODIS sensor on the Terra satellite shows smoke pouring out of two major fires, the Camp Fire and the Woolsey Fire, which both ignited the day before.
Landsat 8 captured satellite views of California’s largest wildfire on record in the summer of 2018. The Mendocino Complex Fire in northern California is a combination of two fires: the Ranch Fire and the River Fire.
Landsat 8 captured satellite views of California's largest wildfire on record in the summer of 2018. The Mendocino Complex fire in northern California is a combination of two fires: the Ranch Fire and the River Fire.
After a month, the wildfires of Southern California are nearly contained. Landsat 8 imagery shows the dramatic burn scars left behind.
At the USGS EROS Center, we study land change, operate the Landsat satellites, and maintain the longest, continuously acquired collection of images of the Earth's land surface.
After a month, the wildfires of Southern California are nearly contained. Landsat 8 imagery shows the dramatic burn scars left behind.
At the USGS EROS Center, we study land change, operate the Landsat satellites, and maintain the longest, continuously acquired collection of images of the Earth's land surface.
In the Landsat 8 image acquired on December 9, smoke is carried west by strong winds, which also continued to spread fire through the dry terrain, mountain passes, and canyons. The diagonal lines are an airplane contrail and its shadow cast on the ground.
The Thomas fire has burned more than 230,000 acres and continues to blaze across souther California. These images show some of the burn scar left behind.
At the USGS EROS Center, we study land change, operate the Landsat satellites, and maintain the longest, continuously acquired collection of images of the Earth's land surface.
The Thomas fire has burned more than 230,000 acres and continues to blaze across souther California. These images show some of the burn scar left behind.
At the USGS EROS Center, we study land change, operate the Landsat satellites, and maintain the longest, continuously acquired collection of images of the Earth's land surface.
California and Landsat
With EROS Earthshots, travel the world at your own pace and see changes to the Earth's surface in these satellite images of environmental transformation. Start in California with Antelope Valley, San Joaquin Valley, and Imperial Valley.
San Joaquin Valley
Antelope Valley
Imperial Valley
Earthshots
The surface of the Earth is always changing. Some changes like earthquakes, volcanoes, floods, and landslides happen quickly, and other changes, such as most erosional processes, happen slowly over time. It’s often hard to see these changes from ground level. Earthshots shows you how satellite data are used to track these changes over time.