
From the Seafloor to Outer Space, USGS is on the Case
The Many Perspectives of USGS
It’s a pale blue dot. It’s also a landscape of jagged peaks and valleys beneath fluffy white clouds. It's a vast field of wispy green grasses and a colony of colorful coral reefs.
Each vantage, whether from a satellite, airplane, ground station or instrument buried beneath ocean waves, offers a different way to monitor Earth’s changing landscape and understand its hidden resources.
To mark the 52nd anniversary of Earth Day, we’ll visit each of these viewpoints, from space down to the seafloor, to explore how USGS scientists are keeping tabs on our everchanging world.
The Sky
Approximately 700 kilometers (440 miles) high in the sky, a couple satellites are busy photographing our planet. They can spot a forest lacking trees, a wildfire burn scar and a river swollen with rainwater.
The Landsat series of satellites has been watching our planet for nearly 50 years, capturing changes on land and making that information freely available to users around the world. Landsat 9 recently joined forces with Landsat 8 to collectively send back 30-meter (98 foot) resolution images on an 8-day cycle. The Landsat satellites are a joint effort between USGS and NASA.

Landsat images provide information that scientists can use to determine the exact extent of a burn area. For example, these series of images were derived from Landsat 8 data as the satellite passed over the Bootleg Fire in Oregon on July 11, 2021. Precisely defining burn areas helps researchers quantify fire trends and patterns so they can better assess fire impacts on natural and human environments.
Learn more about the Landsat mission and how to access Landsat data.
The Air
Closer to home, airplanes and helicopters collect Earth data, albeit a bit more sporadically than Landsat.
Airborne instruments are especially useful for teasing out where minerals are hiding within a rocky outcrop or underneath layers of earth. The Earth Mapping Resources Initiative, or Earth MRI, is a partnership among the USGS, the Association of American State Geologists and other governmental, Tribal and private-sector entities to fly airborne geophysical and lidar surveys over areas that are potential critical mineral hotspots.
Airplanes and helicopters equipped with magnetometers fly over areas suspected of hosting critical minerals and help map the geologic features that respond to magnetic fields buried beneath the ground surface. Once a survey over a specified area is complete, the data can be analyzed in a three-dimensional view. Airborne radiometric surveys use a gamma ray spectrometer that measures the natural radioactivity of rocks and soils near the surface, revealing concentrations of minerals like potassium, uranium and thorium.

Learn more about Earth MRI and Earth MRI in Alaska.
Electromagnetic sensors in flight are also useful for detecting aquifers below ground. The USGS has been conducting airborne geophysical surveys with partners as part of the Mississippi Alluvial Plain Regional Water Availability Study to map nearly 39,000 square miles of the Mississippi River Valley alluvial aquifer system, which spans seven states. The effort began in February 2018 and provides information to improve our understand of groundwater availability.
While some USGS researchers use an airborne vantage to reveal geologic structures, others use it to take high-resolution digital photos of sunbathing sea lions and perched sea birds off the California coast. These aerial photographic surveys create comprehensive maps of seabird and marine mammal distributions.
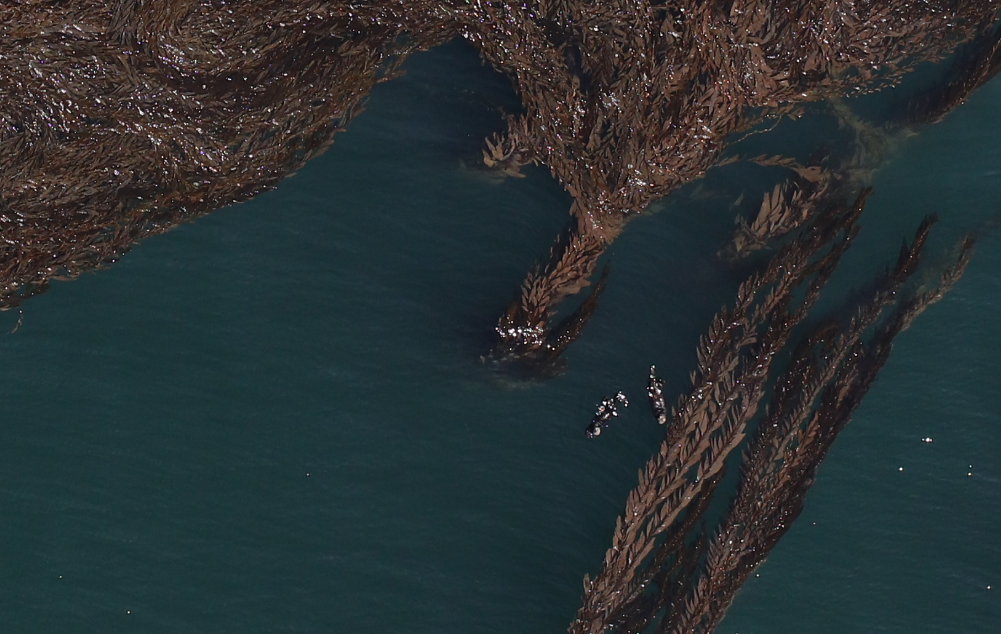
In this zoomed image, there are two Southern Sea Otters relaxing in the middle of kelp beds. Numerous marine mammals and migratory, resident and breeding species of seabirds call California’s ocean waters home. Although these watery habitats are filled with nutrients for the creatures, they’re also at risk from pollution, overfishing, potential offshore wind energy infrastructure development and other stressors. The aerial photo surveys will help inform decision makers as they plan for future developments.
Learn more about airborne surveys to study sea birds and mammals.
The Ground
Instead of taking photos from the air, USGS researchers study grizzly bears by putting tracking devices into their collars on the ground. Grizzly bears roam over rugged terrain throughout most of western North America, but their population levels have declined to a fraction of their historical numbers because of overkilling and landscape changes.
To monitor bears in the Greater Yellowstone Ecosystem and track their habitat use, the Department of the Interior formed the Interagency Grizzly Bear Study Team in 1973 and began tracking the bears a couple years later. The USGS leads the team as it monitors both female and male bears to provide a comprehensive assessment on overall population migrations and trends. Since the mid-1980s, grizzly bear numbers are up in the Greater Yellowstone Ecosystem and today the population once again occupies a historical range approximately 7 times the size of Yellowstone National Park.

Grizzly bears survey their surroundings in the Greater Yellowstone Ecosystem. These grizzly bears are not picky eaters. The team has recorded them eating everything from herbaceous plants, tubers berries, and nuts to animals, insects and fungi.
Read more about USGS science on grizzly bears.
Perhaps not as charismatic as a grizzly bear, a USGS streamgage is, nevertheless, a very important part of the landscape. Often installed next to a river or stream or mounted on a bridge, its instruments measure water level. To determine how fast the water flows, USGS hydrologists and hydrologic technicians take streamflow measurements on the river or stream. Then, they develop a mathematical relation between the streamflow measurement and the water height values that the streamgage regularly collects. They use that mathematical relation to compute streamflow information every 15 minutes.
There are over 8,000 USGS streamgages in every state, as well as the District of Columbia, Puerto Rico and Guam. Not only do recreation seekers and fish enthusiasts rely on streamgages to determine water conditions, federal, state and local land managers use them to inform decisions and scientists use them to understand their local watershed and ecosystem.

The USGS streamgage on Cement Creek at Silverton, Colorado, measures continuous stream height and discharge. Cement Creek is part of the Animas River Watershed in southwest Colorado.
Read more about USGS streamgages.
Another USGS instrument that sits on the landscape is a seismometer. However, unlike streamgages, seismometers are not partial to water; they prefer being close to regions with potential tectonic activity.
The Advanced National Seismic System includes a backbone network of seismometers across the country, the National Earthquake Information Center, the National Strong Motion Project, and 15 regional seismic networks operated by USGS and its partners.

When an earthquake strikes, the system provides real-time information that aids emergency response. The USGS ShakeAlert earthquake early warning system is part of the Advanced National Seismic System and monitors for significant earthquakes. It currently covers California, Oregon and Washington State.
Read more about how USGS monitors earthquakes around the world.
USGS also monitors volcanoes to enhance public safety and minimize social and economic impacts from volcanic activity and eruption. To keep tabs on the 161 potentially active volcanoes in the U.S., the USGS runs five volcano observatories that monitor, research and issue formal notices on volcanic activity. They are the: Alaska, California, Cascades, Hawaiian and Yellowstone Volcano Observatories.

An icy view at a telemetry station north of Mount St. Helens, Washington. The Cascades Volcano Observatory uses a variety of instruments and techniques to monitor volcanic unrest.
Read more about how USGS monitors volcanoes.
The Seafloor
At a much deeper vantage, USGS researchers are monitoring what’s happening on the seafloor to better understand risks from tectonic activity that could impact public safety.
In earthquake-prone regions, like the west coast of the Americas, a surge of underwater movement could impact people and their environment along the coast.
Marine geohazards are sudden and extreme events that happen when one tectonic plate compresses another, like the Cascadia Subduction Zone or Aleutian Trench, or when one plate moves horizontally past another, like in central and Southern California. This seafloor movement can generate earthquakes, which can cause underwater landslides and trigger tsunamis.

To study what happens at the seafloor, USGS scientists use sonar-generated images like this one, which shows topography and the potential for landslides near the head of Resurrection Bay, Alaska. Sonar is a system for detecting objects under water by emitting sound pulses and measuring how long it takes for the pulses to bounce back.
USGS scientists use sonar technology to create three-dimensional views of the seafloor to depths of 12 km to examine how faults work and how landslides could occur.
Learn more about USGS efforts to study marine geohazards.
Although the seafloor can be a tumultuous place, it can also be a vibrant community of starfish, sea turtles, sea cucumbers, and a variety of brightly hued fish swimming around a coral reef. USGS scientists are studying both the creatures that live at the bottom of the sea, as well as the tectonic processes that start shift the seafloor.
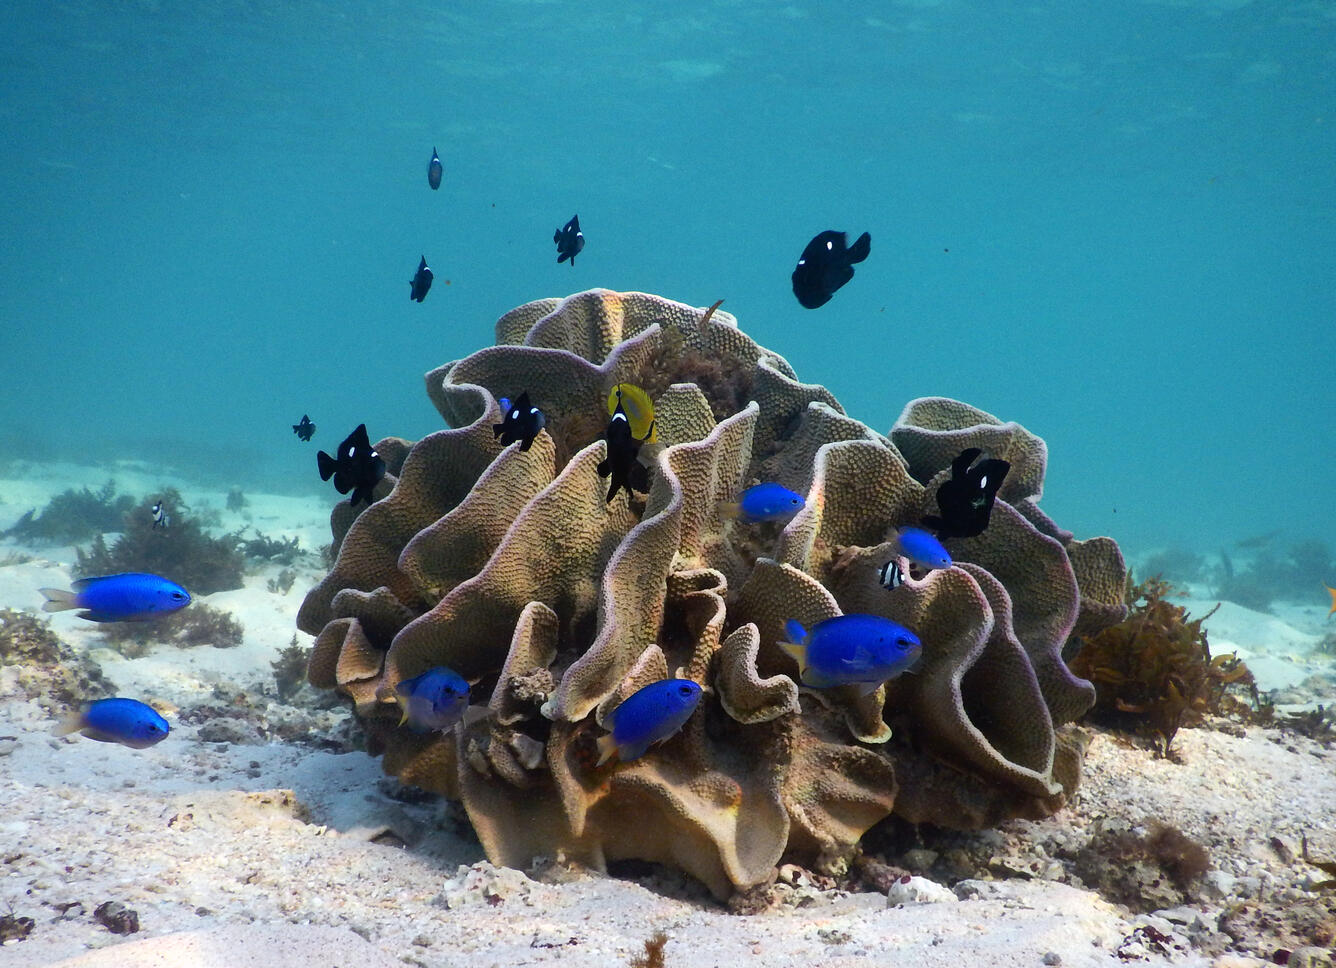
On the bottom of the seafloor off the coast of Western Australia, bright blue damselfish swim in and around a tan lettuce-leaf coral. USGS researchers worked with Australian colleagues to study how eroding reefs become sand on beaches. Since sand acts as a natural barrier between the coast and the sea, understanding this connection can tell us how resilient the coast will be as sea level rises with climate change.
Learn more about USGS efforts to study coral reef systems.
Four perspectives in one Agency
Next time you’re diving among corals, walking along a stream, peering down from an airplane or looking at an image from space, you can think, this is the same vantage that USGS scientists use to study our planet. For us, every day is Earth Day.
Get Our News
These items are in the RSS feed format (Really Simple Syndication) based on categories such as topics, locations, and more. You can install and RSS reader browser extension, software, or use a third-party service to receive immediate news updates depending on the feed that you have added. If you click the feed links below, they may look strange because they are simply XML code. An RSS reader can easily read this code and push out a notification to you when something new is posted to our site.