
January to March 2026
Get the facts and figures about the USGS Streamgaging Network, one of the largest streamgaging enterprises in the world!
Media

Sources/Usage: Public Domain. View Media Details
All numbers below are for 2026.
National Streamgage Network
12,330 Streamgages
- Just over 9,100 monitor streamflow and water level year-round
- Over 3,200 only record water level or operate less than year-round
- Centennial Streamgages - have more than 100 years of records
- CY 2026 - 1,200
- CY 2025 - 1,060
Media

Sources/Usage: Public Domain. View Media Details
Federal Priority Streamgages
~7,330 (of 12,400 eligible FPS sites) active streamgages
- ~1,175 are fully funded by USGS FPS appropriations
- 5,070 eligible locations inactive due to lack of funding
Funding
Approximately \$230 million
- \$60 million from Federal appropriations
- Approximately \$170 million from nearly 1,500 partners
Water Data Delivery
In FY25, 2.06 billion of the 3.3 billion requests for USGS water information were for streamflow data
- Nearly 98% of requests fulfilled through web services
Media
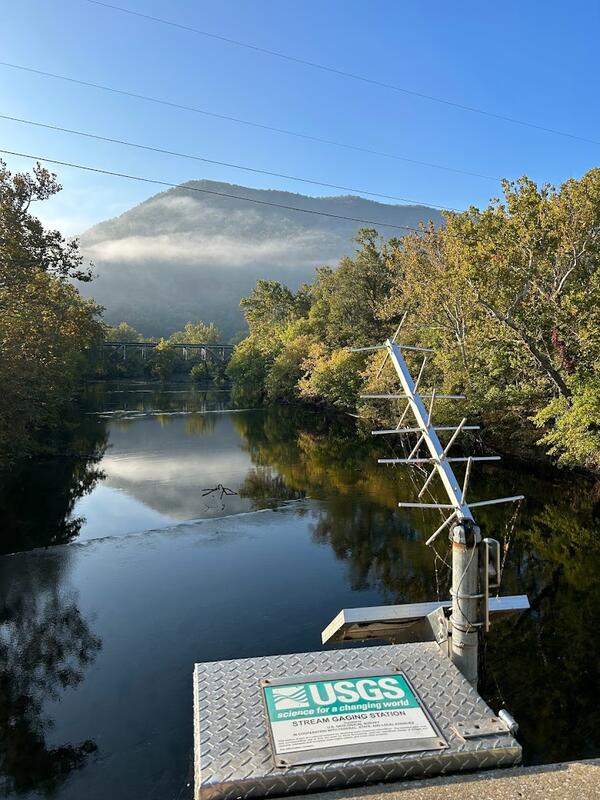
The USGS monitoring station 01634000 on the North Fork Shenandoah River near Strasburg.
Sources/Usage: Public Domain. View Media Details
Media
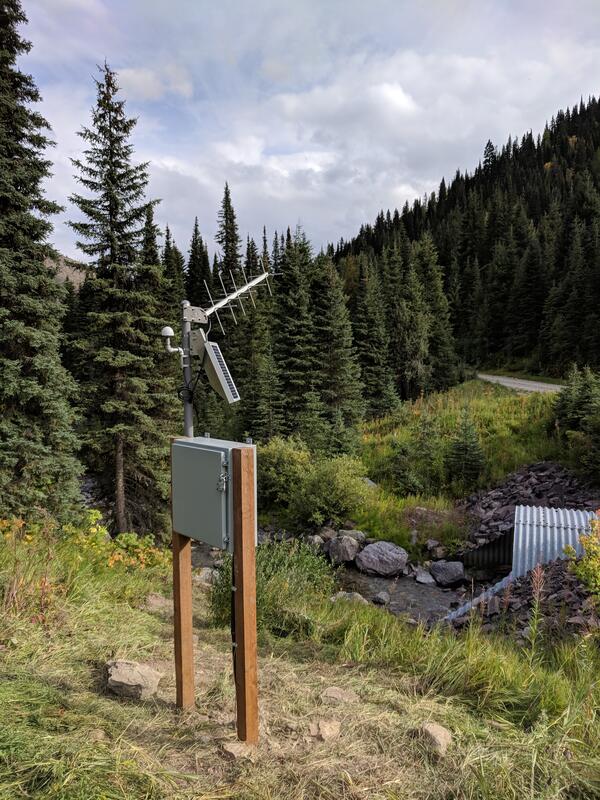
Hallowat Creek abv Kletomus Ck, nr Olney (12355342) streamgage
Sources/Usage: Public Domain. View Media Details
Below are other science projects associated with the USGS streamgaging network.

USGS National Streamgaging Network
As of October 2024, the USGS Groundwater and Streamflow Information Program supports the collection and (or) delivery of both streamflow and water-level information at 8,705 sites and water-level information alone at 3,460 additional sites. The data are served online—most in near real-time—to meet many diverse needs including the protection of life, property, the environment, and our economy.

Federal Priority Streamgages (FPS)
Federal Priority Streamgages (FPS) are automated stations that monitor water conditions in streams and rivers throughout the country. Originally established in 1999, these are important for meeting specific long-term needs of the Nation. The FPS Network was recently re-prioritized which resulted in size of the network increasing to nearly 12,400 locations.

Rapid Deployment Gages (RDGs)
Rapid Deployment Gages (RDGs) are fully-functional streamgages designed to be deployed quickly and temporarily to measure and transmit stream stage data in emergency situations.

Streamgaging Basics
Information on the flow of rivers and streams is a vital national asset that safeguards lives, protects property, and ensures adequate water supplies for the future. The USGS operates a network of more than 13,500 streamgages nationwide that provide streamflow information for a wide variety of uses including flood prediction, water management and allocation, engineering design, research, operation...

Surge, Wave, and Tide Hydrologic (SWaTH) Network in Maryland, Delaware, and the District of Columbia
Many U.S. Geological Survey Water Science Centers have responsibilities for coastal regions within their mission areas. The integrated Surge, Wave, and Tide Hydrologic (SWaTH) Network has been developed in the wake of Hurricane Sandy to support model development and verification for coastal regions, detection of hydrologic trends, and early warning of hydrologic hazards in the northeast from...
Filter Total Items: 33

U.S. River Conditions, January to March 2026

U.S. River Conditions, Water Year 2025
This is an animation showing the changing conditions relative to the historic record of USGS streamgages from October 1, 2024 - September 30, 2025. The river conditions shown range from the driest condition seen at a gage (red open circles) to the wettest (blue closed circles). A purple outer ring around a gage indicates it is flooding.
This is an animation showing the changing conditions relative to the historic record of USGS streamgages from October 1, 2024 - September 30, 2025. The river conditions shown range from the driest condition seen at a gage (red open circles) to the wettest (blue closed circles). A purple outer ring around a gage indicates it is flooding.

U.S. River Conditions, July to September 2025
This is an animation showing the changing conditions relative to the historic record of USGS streamgages from July 1, 2025, to September 30, 2025. The river conditions shown range from the driest condition seen at a gage (red open circles) to the wettest (blue closed circles). A purple outer ring around a gage indicates it is flooding.
This is an animation showing the changing conditions relative to the historic record of USGS streamgages from July 1, 2025, to September 30, 2025. The river conditions shown range from the driest condition seen at a gage (red open circles) to the wettest (blue closed circles). A purple outer ring around a gage indicates it is flooding.

U.S. River Conditions, April to June 2025
This is an animation showing the changing conditions relative to the historic record of USGS streamgages from April 1, 2025 to June 30, 2025. The river conditions shown range from the driest condition seen at a gage (red open circles) to the wettest (blue closed circles). A purple outer ring around a gage indicates it is flooding.
This is an animation showing the changing conditions relative to the historic record of USGS streamgages from April 1, 2025 to June 30, 2025. The river conditions shown range from the driest condition seen at a gage (red open circles) to the wettest (blue closed circles). A purple outer ring around a gage indicates it is flooding.

U.S. River Conditions, January to March 2025
This is an animation showing the changing conditions relative to the historic record of USGS streamgages from January 1, 2025 to March 31, 2025. The river conditions shown range from the driest condition seen at a gage (red open circles) to the wettest (blue closed circles). A purple outer ring around a gage indicates it is flooding.
This is an animation showing the changing conditions relative to the historic record of USGS streamgages from January 1, 2025 to March 31, 2025. The river conditions shown range from the driest condition seen at a gage (red open circles) to the wettest (blue closed circles). A purple outer ring around a gage indicates it is flooding.

U.S. River Conditions, October to December 2025
October to December 2025

U.S. River Conditions, October to December 2024
This is an animation showing the changing conditions relative to the historic record of USGS streamgages from October 1, 2024 to December 31, 2024. The river conditions shown range from the driest condition seen at a gage (red open circles) to the wettest (blue closed circles). A purple outer ring around a gage indicates it is flooding.
This is an animation showing the changing conditions relative to the historic record of USGS streamgages from October 1, 2024 to December 31, 2024. The river conditions shown range from the driest condition seen at a gage (red open circles) to the wettest (blue closed circles). A purple outer ring around a gage indicates it is flooding.

U.S. River Conditions for Water Year 2024
This is an animation showing the changing conditions relative to the historic record of USGS streamgages from October 1, 2023 - September 30, 2024. The river conditions shown range from the driest condition seen at a gage (red open circles) to the wettest (blue closed circles). A purple outer ring around a gage indicates it is flooding.
This is an animation showing the changing conditions relative to the historic record of USGS streamgages from October 1, 2023 - September 30, 2024. The river conditions shown range from the driest condition seen at a gage (red open circles) to the wettest (blue closed circles). A purple outer ring around a gage indicates it is flooding.

U.S. River Conditions, July to September 2024
This is an animation showing the changing conditions relative to the historic record of USGS streamgages from July 1, 2024 to September 30, 2024. The river conditions shown range from the driest condition seen at a gage (red open circles) to the wettest (blue closed circles). A purple outer ring around a gage indicates it is flooding.
This is an animation showing the changing conditions relative to the historic record of USGS streamgages from July 1, 2024 to September 30, 2024. The river conditions shown range from the driest condition seen at a gage (red open circles) to the wettest (blue closed circles). A purple outer ring around a gage indicates it is flooding.

U.S. River Conditions, April to June 2024
This is an animation showing the changing conditions relative to the historic record of USGS streamgages from April 1, 2024 to June 30, 2024. The river conditions shown range from the driest condition seen at a gage (red open circles) to the wettest (blue closed circles). A purple outer ring around a gage indicates it is flooding.
This is an animation showing the changing conditions relative to the historic record of USGS streamgages from April 1, 2024 to June 30, 2024. The river conditions shown range from the driest condition seen at a gage (red open circles) to the wettest (blue closed circles). A purple outer ring around a gage indicates it is flooding.

U.S. River Conditions, January to March 2024
This is an animation showing the changing conditions relative to the historic record of USGS streamgages from January 1, 2024 to March 31, 2024. The river conditions shown range from the driest condition seen at a gage (red open circles) to the wettest (blue closed circles). A purple outer ring around a gage indicates it is flooding.
This is an animation showing the changing conditions relative to the historic record of USGS streamgages from January 1, 2024 to March 31, 2024. The river conditions shown range from the driest condition seen at a gage (red open circles) to the wettest (blue closed circles). A purple outer ring around a gage indicates it is flooding.

U.S. River Conditions, October to December 2023
This is an animation showing the changing conditions relative to the historic record of USGS streamgages from October 1, 2023 to December 31, 2023. The river conditions shown range from the driest condition seen at a gage (red open circles) to the wettest (blue closed circles). A purple outer ring around a gage indicates it is flooding.
This is an animation showing the changing conditions relative to the historic record of USGS streamgages from October 1, 2023 to December 31, 2023. The river conditions shown range from the driest condition seen at a gage (red open circles) to the wettest (blue closed circles). A purple outer ring around a gage indicates it is flooding.

U.S. River Conditions, July to September 2023
This is an animation showing the changing conditions relative to the historic record of USGS streamgages from July 1, 2023 to September 30, 2023. The river conditions shown range from the driest condition seen at a gage (red open circles) to the wettest (blue closed circles). A purple outer ring around a gage indicates it is flooding.
This is an animation showing the changing conditions relative to the historic record of USGS streamgages from July 1, 2023 to September 30, 2023. The river conditions shown range from the driest condition seen at a gage (red open circles) to the wettest (blue closed circles). A purple outer ring around a gage indicates it is flooding.

U.S. River Conditions, April to June 2023
This is an animation showing the changing conditions relative to the historic record of USGS streamgages from April 1, 2023 to June 30, 2023. The river conditions shown range from the driest condition seen at a gage (red open circles) to the wettest (blue closed circles). A purple outer ring around a gage indicates it is flooding.
This is an animation showing the changing conditions relative to the historic record of USGS streamgages from April 1, 2023 to June 30, 2023. The river conditions shown range from the driest condition seen at a gage (red open circles) to the wettest (blue closed circles). A purple outer ring around a gage indicates it is flooding.

U.S. River Conditions, January to March 2023
This is an animation showing the changing conditions relative to the historic record of USGS streamgages from January 1, 2023 to March 31, 2023. The river conditions shown range from the driest condition seen at a gage (red open circles) to the wettest (blue closed circles). A purple outer ring around a gage indicates it is flooding.
This is an animation showing the changing conditions relative to the historic record of USGS streamgages from January 1, 2023 to March 31, 2023. The river conditions shown range from the driest condition seen at a gage (red open circles) to the wettest (blue closed circles). A purple outer ring around a gage indicates it is flooding.

U.S. River Conditions, October to December 2022
Video Description – October to December 2022

U.S. River Conditions, October 2021 to September 2022
U.S. River Conditions, October 2021 to September 2022Video Description – Water Year: October 2021 to September 2022
U.S. River Conditions, October 2021 to September 2022
U.S. River Conditions, October 2021 to September 2022Video Description – Water Year: October 2021 to September 2022

U.S. River Conditions, July to September 2022
This is an animation showing the changing conditions relative to the historic daily record of USGS streamgages from July 1, 2022 to September 30, 2022. The river conditions shown range from the driest condition seen at a gage (red open circles) to the wettest (blue closed circles). A purple outer ring around a gage indicates it is flooding.
This is an animation showing the changing conditions relative to the historic daily record of USGS streamgages from July 1, 2022 to September 30, 2022. The river conditions shown range from the driest condition seen at a gage (red open circles) to the wettest (blue closed circles). A purple outer ring around a gage indicates it is flooding.

U.S. River Conditions, April to June 2022
This is an animation showing the changing conditions of USGS streamgages from April 1, 2022 to June 30, 2022. The river conditions shown range from the driest condition seen at a gage (red open circles) to the wettest (blue closed circles). A purple outer ring around a gage indicates it is flooding.
This is an animation showing the changing conditions of USGS streamgages from April 1, 2022 to June 30, 2022. The river conditions shown range from the driest condition seen at a gage (red open circles) to the wettest (blue closed circles). A purple outer ring around a gage indicates it is flooding.

U.S. River Conditions, January to March 2022
This is an animation showing the changing conditions of USGS streamgages from January 1, 2022 to March 31, 2022. The river conditions shown range from the driest condition seen at a gage (red open circles) to the wettest (blue closed circles). A purple outer ring around a gage indicates it is flooding.
This is an animation showing the changing conditions of USGS streamgages from January 1, 2022 to March 31, 2022. The river conditions shown range from the driest condition seen at a gage (red open circles) to the wettest (blue closed circles). A purple outer ring around a gage indicates it is flooding.

U.S. River Conditions, October to December 2021
This is an animation showing the changing conditions of USGS streamgages from October 1, 2021 to December 31, 2021. The river conditions shown range from the driest condition seen at a gage (red open circles) to the wettest (blue closed circles). A purple outer ring around a gage indicates it is flooding.
This is an animation showing the changing conditions of USGS streamgages from October 1, 2021 to December 31, 2021. The river conditions shown range from the driest condition seen at a gage (red open circles) to the wettest (blue closed circles). A purple outer ring around a gage indicates it is flooding.
Get the facts and figures about the USGS Streamgaging Network, one of the largest streamgaging enterprises in the world!
Media
Sources/Usage: Public Domain. View Media Details
All numbers below are for 2026.
National Streamgage Network
12,330 Streamgages
- Just over 9,100 monitor streamflow and water level year-round
- Over 3,200 only record water level or operate less than year-round
- Centennial Streamgages - have more than 100 years of records
- CY 2026 - 1,200
- CY 2025 - 1,060
Media
Sources/Usage: Public Domain. View Media Details
Federal Priority Streamgages
~7,330 (of 12,400 eligible FPS sites) active streamgages
- ~1,175 are fully funded by USGS FPS appropriations
- 5,070 eligible locations inactive due to lack of funding
Funding
Approximately \$230 million
- \$60 million from Federal appropriations
- Approximately \$170 million from nearly 1,500 partners
Water Data Delivery
In FY25, 2.06 billion of the 3.3 billion requests for USGS water information were for streamflow data
- Nearly 98% of requests fulfilled through web services
Media
The USGS monitoring station 01634000 on the North Fork Shenandoah River near Strasburg.
Sources/Usage: Public Domain. View Media Details
Media
Hallowat Creek abv Kletomus Ck, nr Olney (12355342) streamgage
Sources/Usage: Public Domain. View Media Details
Below are other science projects associated with the USGS streamgaging network.
USGS National Streamgaging Network
As of October 2024, the USGS Groundwater and Streamflow Information Program supports the collection and (or) delivery of both streamflow and water-level information at 8,705 sites and water-level information alone at 3,460 additional sites. The data are served online—most in near real-time—to meet many diverse needs including the protection of life, property, the environment, and our economy.
Federal Priority Streamgages (FPS)
Federal Priority Streamgages (FPS) are automated stations that monitor water conditions in streams and rivers throughout the country. Originally established in 1999, these are important for meeting specific long-term needs of the Nation. The FPS Network was recently re-prioritized which resulted in size of the network increasing to nearly 12,400 locations.
Rapid Deployment Gages (RDGs)
Rapid Deployment Gages (RDGs) are fully-functional streamgages designed to be deployed quickly and temporarily to measure and transmit stream stage data in emergency situations.
Streamgaging Basics
Information on the flow of rivers and streams is a vital national asset that safeguards lives, protects property, and ensures adequate water supplies for the future. The USGS operates a network of more than 13,500 streamgages nationwide that provide streamflow information for a wide variety of uses including flood prediction, water management and allocation, engineering design, research, operation...
Surge, Wave, and Tide Hydrologic (SWaTH) Network in Maryland, Delaware, and the District of Columbia
Many U.S. Geological Survey Water Science Centers have responsibilities for coastal regions within their mission areas. The integrated Surge, Wave, and Tide Hydrologic (SWaTH) Network has been developed in the wake of Hurricane Sandy to support model development and verification for coastal regions, detection of hydrologic trends, and early warning of hydrologic hazards in the northeast from...
Filter Total Items: 33
U.S. River Conditions, January to March 2026
January to March 2026
U.S. River Conditions, Water Year 2025
This is an animation showing the changing conditions relative to the historic record of USGS streamgages from October 1, 2024 - September 30, 2025. The river conditions shown range from the driest condition seen at a gage (red open circles) to the wettest (blue closed circles). A purple outer ring around a gage indicates it is flooding.
This is an animation showing the changing conditions relative to the historic record of USGS streamgages from October 1, 2024 - September 30, 2025. The river conditions shown range from the driest condition seen at a gage (red open circles) to the wettest (blue closed circles). A purple outer ring around a gage indicates it is flooding.
U.S. River Conditions, July to September 2025
This is an animation showing the changing conditions relative to the historic record of USGS streamgages from July 1, 2025, to September 30, 2025. The river conditions shown range from the driest condition seen at a gage (red open circles) to the wettest (blue closed circles). A purple outer ring around a gage indicates it is flooding.
This is an animation showing the changing conditions relative to the historic record of USGS streamgages from July 1, 2025, to September 30, 2025. The river conditions shown range from the driest condition seen at a gage (red open circles) to the wettest (blue closed circles). A purple outer ring around a gage indicates it is flooding.
U.S. River Conditions, April to June 2025
This is an animation showing the changing conditions relative to the historic record of USGS streamgages from April 1, 2025 to June 30, 2025. The river conditions shown range from the driest condition seen at a gage (red open circles) to the wettest (blue closed circles). A purple outer ring around a gage indicates it is flooding.
This is an animation showing the changing conditions relative to the historic record of USGS streamgages from April 1, 2025 to June 30, 2025. The river conditions shown range from the driest condition seen at a gage (red open circles) to the wettest (blue closed circles). A purple outer ring around a gage indicates it is flooding.
U.S. River Conditions, January to March 2025
This is an animation showing the changing conditions relative to the historic record of USGS streamgages from January 1, 2025 to March 31, 2025. The river conditions shown range from the driest condition seen at a gage (red open circles) to the wettest (blue closed circles). A purple outer ring around a gage indicates it is flooding.
This is an animation showing the changing conditions relative to the historic record of USGS streamgages from January 1, 2025 to March 31, 2025. The river conditions shown range from the driest condition seen at a gage (red open circles) to the wettest (blue closed circles). A purple outer ring around a gage indicates it is flooding.
U.S. River Conditions, October to December 2025
October to December 2025
U.S. River Conditions, October to December 2024
This is an animation showing the changing conditions relative to the historic record of USGS streamgages from October 1, 2024 to December 31, 2024. The river conditions shown range from the driest condition seen at a gage (red open circles) to the wettest (blue closed circles). A purple outer ring around a gage indicates it is flooding.
This is an animation showing the changing conditions relative to the historic record of USGS streamgages from October 1, 2024 to December 31, 2024. The river conditions shown range from the driest condition seen at a gage (red open circles) to the wettest (blue closed circles). A purple outer ring around a gage indicates it is flooding.
U.S. River Conditions for Water Year 2024
This is an animation showing the changing conditions relative to the historic record of USGS streamgages from October 1, 2023 - September 30, 2024. The river conditions shown range from the driest condition seen at a gage (red open circles) to the wettest (blue closed circles). A purple outer ring around a gage indicates it is flooding.
This is an animation showing the changing conditions relative to the historic record of USGS streamgages from October 1, 2023 - September 30, 2024. The river conditions shown range from the driest condition seen at a gage (red open circles) to the wettest (blue closed circles). A purple outer ring around a gage indicates it is flooding.
U.S. River Conditions, July to September 2024
This is an animation showing the changing conditions relative to the historic record of USGS streamgages from July 1, 2024 to September 30, 2024. The river conditions shown range from the driest condition seen at a gage (red open circles) to the wettest (blue closed circles). A purple outer ring around a gage indicates it is flooding.
This is an animation showing the changing conditions relative to the historic record of USGS streamgages from July 1, 2024 to September 30, 2024. The river conditions shown range from the driest condition seen at a gage (red open circles) to the wettest (blue closed circles). A purple outer ring around a gage indicates it is flooding.
U.S. River Conditions, April to June 2024
This is an animation showing the changing conditions relative to the historic record of USGS streamgages from April 1, 2024 to June 30, 2024. The river conditions shown range from the driest condition seen at a gage (red open circles) to the wettest (blue closed circles). A purple outer ring around a gage indicates it is flooding.
This is an animation showing the changing conditions relative to the historic record of USGS streamgages from April 1, 2024 to June 30, 2024. The river conditions shown range from the driest condition seen at a gage (red open circles) to the wettest (blue closed circles). A purple outer ring around a gage indicates it is flooding.
U.S. River Conditions, January to March 2024
This is an animation showing the changing conditions relative to the historic record of USGS streamgages from January 1, 2024 to March 31, 2024. The river conditions shown range from the driest condition seen at a gage (red open circles) to the wettest (blue closed circles). A purple outer ring around a gage indicates it is flooding.
This is an animation showing the changing conditions relative to the historic record of USGS streamgages from January 1, 2024 to March 31, 2024. The river conditions shown range from the driest condition seen at a gage (red open circles) to the wettest (blue closed circles). A purple outer ring around a gage indicates it is flooding.
U.S. River Conditions, October to December 2023
This is an animation showing the changing conditions relative to the historic record of USGS streamgages from October 1, 2023 to December 31, 2023. The river conditions shown range from the driest condition seen at a gage (red open circles) to the wettest (blue closed circles). A purple outer ring around a gage indicates it is flooding.
This is an animation showing the changing conditions relative to the historic record of USGS streamgages from October 1, 2023 to December 31, 2023. The river conditions shown range from the driest condition seen at a gage (red open circles) to the wettest (blue closed circles). A purple outer ring around a gage indicates it is flooding.
U.S. River Conditions, July to September 2023
This is an animation showing the changing conditions relative to the historic record of USGS streamgages from July 1, 2023 to September 30, 2023. The river conditions shown range from the driest condition seen at a gage (red open circles) to the wettest (blue closed circles). A purple outer ring around a gage indicates it is flooding.
This is an animation showing the changing conditions relative to the historic record of USGS streamgages from July 1, 2023 to September 30, 2023. The river conditions shown range from the driest condition seen at a gage (red open circles) to the wettest (blue closed circles). A purple outer ring around a gage indicates it is flooding.
U.S. River Conditions, April to June 2023
This is an animation showing the changing conditions relative to the historic record of USGS streamgages from April 1, 2023 to June 30, 2023. The river conditions shown range from the driest condition seen at a gage (red open circles) to the wettest (blue closed circles). A purple outer ring around a gage indicates it is flooding.
This is an animation showing the changing conditions relative to the historic record of USGS streamgages from April 1, 2023 to June 30, 2023. The river conditions shown range from the driest condition seen at a gage (red open circles) to the wettest (blue closed circles). A purple outer ring around a gage indicates it is flooding.
U.S. River Conditions, January to March 2023
This is an animation showing the changing conditions relative to the historic record of USGS streamgages from January 1, 2023 to March 31, 2023. The river conditions shown range from the driest condition seen at a gage (red open circles) to the wettest (blue closed circles). A purple outer ring around a gage indicates it is flooding.
This is an animation showing the changing conditions relative to the historic record of USGS streamgages from January 1, 2023 to March 31, 2023. The river conditions shown range from the driest condition seen at a gage (red open circles) to the wettest (blue closed circles). A purple outer ring around a gage indicates it is flooding.
U.S. River Conditions, October to December 2022
Video Description – October to December 2022
U.S. River Conditions, October 2021 to September 2022
U.S. River Conditions, October 2021 to September 2022Video Description – Water Year: October 2021 to September 2022
U.S. River Conditions, October 2021 to September 2022
U.S. River Conditions, October 2021 to September 2022Video Description – Water Year: October 2021 to September 2022
U.S. River Conditions, July to September 2022
This is an animation showing the changing conditions relative to the historic daily record of USGS streamgages from July 1, 2022 to September 30, 2022. The river conditions shown range from the driest condition seen at a gage (red open circles) to the wettest (blue closed circles). A purple outer ring around a gage indicates it is flooding.
This is an animation showing the changing conditions relative to the historic daily record of USGS streamgages from July 1, 2022 to September 30, 2022. The river conditions shown range from the driest condition seen at a gage (red open circles) to the wettest (blue closed circles). A purple outer ring around a gage indicates it is flooding.
U.S. River Conditions, April to June 2022
This is an animation showing the changing conditions of USGS streamgages from April 1, 2022 to June 30, 2022. The river conditions shown range from the driest condition seen at a gage (red open circles) to the wettest (blue closed circles). A purple outer ring around a gage indicates it is flooding.
This is an animation showing the changing conditions of USGS streamgages from April 1, 2022 to June 30, 2022. The river conditions shown range from the driest condition seen at a gage (red open circles) to the wettest (blue closed circles). A purple outer ring around a gage indicates it is flooding.
U.S. River Conditions, January to March 2022
This is an animation showing the changing conditions of USGS streamgages from January 1, 2022 to March 31, 2022. The river conditions shown range from the driest condition seen at a gage (red open circles) to the wettest (blue closed circles). A purple outer ring around a gage indicates it is flooding.
This is an animation showing the changing conditions of USGS streamgages from January 1, 2022 to March 31, 2022. The river conditions shown range from the driest condition seen at a gage (red open circles) to the wettest (blue closed circles). A purple outer ring around a gage indicates it is flooding.
U.S. River Conditions, October to December 2021
This is an animation showing the changing conditions of USGS streamgages from October 1, 2021 to December 31, 2021. The river conditions shown range from the driest condition seen at a gage (red open circles) to the wettest (blue closed circles). A purple outer ring around a gage indicates it is flooding.
This is an animation showing the changing conditions of USGS streamgages from October 1, 2021 to December 31, 2021. The river conditions shown range from the driest condition seen at a gage (red open circles) to the wettest (blue closed circles). A purple outer ring around a gage indicates it is flooding.