
Coastal and Marine Geohazards of the U.S. West Coast and Alaska
National Archive of Marine Seismic Surveys
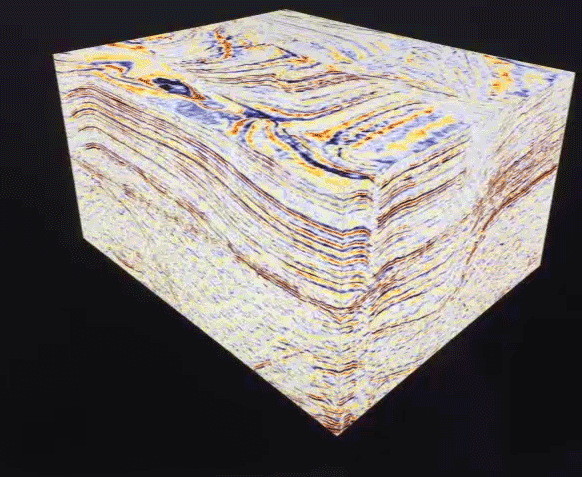
Access offshore 2D and 3D seismic data within the U.S. Exclusive Economic Zone
Coastal and marine geohazards are sudden and extreme events beneath the ocean that threaten coastal populations. These underwater hazards include earthquakes, volcanic eruptions, landslides, and tsunamis.
The tectonically active west coast of the Americas is prone to such hazards, as it lies along the boundaries of major tectonic plates that make up the Earth's crust—the North American, Caribbean, and South American Plates and the ocean plates to the west.
Along tectonic boundaries, sudden seafloor movement can cause significant damage to coastal communities.
Such hazards include shaking by large earthquakes in subduction zones, where one tectonic plate compresses another (examples include Cascadia and the Aleutian Trench); or on strike-slip faults, where one tectonic plate moves horizontally past another (such as in central and southern California). Related hazards include tsunamis generated by shifts in the seafloor or by underwater landslides that occur during earthquakes. Landslides can also threaten infrastructure on the ocean floor such as pipelines, communication cables, and oil platforms.
Understanding how different regions might be affected by coastal and marine geohazards is an important, yet complex problem. To assess risks of future geohazards, scientists in the USGS Coastal and Marine Geohazards group turn to the past for seismic evidence.
Scroll down to learn more or click the images below to jump to specific geographic settings covered by this research project.
Offshore Faults of California
Cascadia Subduction Zone
Offshore Faults of Southeast Alaska
People have been recording seismic activity for centuries. To assemble a detailed earthquake history of an area and understand how faults may behave in the future, however, scientists need to go further back in time—from several hundred to many thousands of years ago.
One barrier to accurately measuring seismic risk in coastal and marine settings has been the scarcity of high-resolution maps of the ocean floor. The technology for mapping large parts of the seafloor with enough detail needed to study offshore faults has only been available for about the last 30 years, long after coastal areas had been densely developed.
To better understand an offshore fault’s structure and behavior, USGS scientists go to sea to collect streams of data that they turn into comprehensive bathymetric and sub-bottom maps. This type of imaging, along with knowing the age of sediment along faults and measuring other factors such as magnetics and density, can help tell the story of when the fault last ruptured or how fast it’s moving. Using modern mapping and seismic technology to gather detailed seafloor data can directly impact human life and cities by improving earthquake and tsunami forecasts.
The USGS Coastal and Marine Geohazards team applies this technology to the seafloor offshore of several urban regions along the West Coast. For example, the San Francisco Bay Area has the highest density of active faults of any urban area in the nation; the densely populated expanse (approximately 23 million people) in southern California is threatened by the nation’s highest level of earthquake risk; and Alaska has had more large earthquakes than the rest of the U.S. combined. In addition, detailed imaging of the ocean bottom has uncovered new evidence of submarine landslides. Creating three-dimensional views of the seafloor down to depths of 12 kilometers has given scientists remarkable ways to examine how a fault works, or how fluids may follow underground paths and possibly trigger landslides.

Reassessing the threat of earthquake, tsunami, and landslide hazards to ports and nuclear power plants on the U.S. west coast can directly impact facility management, emergency-management planning, and plant re-licensing. The data can also affect building codes, the design of highways, bridges, and other large structures, as well as earthquake insurance rates.


Northern and Central California
The most significant faults within the plate boundary in central and northern California include the San Andreas, San Gregorio-Hosgri, and Hayward-Rodgers Creek fault zones. Each of these fault zones has important offshore sections that, until recently, were not mapped in great detail. For 300 kilometers between Pacifica and Cape Mendocino, about 60 percent of the trace of the San Andreas fault lies beneath the ocean floor. West of the San Andreas fault, the 400-kilometer-long San Gregorio-Hosgri fault extends primarily offshore between Point Conception and Bolinas, and sits within 3 nautical miles (in state waters) of the Diablo Canyon Power Plant. East of the San Andreas fault, the Hayward and Rodgers Creek faults are considered the most likely faults in the San Francisco Bay area to have a damaging (magnitude greater than 6.7) earthquake in the next 30 years.

The USGS is collecting higher-resolution offshore geophysical data to better characterize these faults. Scientists bounce sound off the seafloor to image the bottom (bathymetric mapping), or image the layers of sediment and rock beneath the seafloor (seismic mapping). For example, multibeam sonar and chirp systems both use high frequency sound to create detailed views, respectively, of the seafloor and features beneath the seafloor. Lower frequency sound sources, such as the mini-sparker, can penetrate deeper and image as much as 300 meters below the seafloor. In addition, detailed measurements of the Earth’s gravitational and magnetic fields near the seafloor can tell us about the physical properties of rocks on and below the seafloor, and help scientists locate and estimate the shape (dip) of the faults that cut those rocks.

Research Highlight: Hosgri Fault
USGS mapped the Hosgri fault zone in high-resolution for about 100 kilometers between Piedras Blancas and Point Sal in central California, where the fault runs within 3 nautical miles of the Diablo Canyon Power Plant. This comprehensive imaging helped highlight fault connections, which are important because longer faults can produce larger earthquakes. This level of detail also revealed the diversity of deformation along the fault, showing uplifts and depressions from small bends—a complexity not captured by previous mapping techniques. By using cutting-edge analysis, USGS scientists also examined seismic data in three dimensions along a fault bend in the Hosgri fault zone to help visualize the fault and spot pathways that fluids might follow.
Comprehensive mapping is important not only for capturing nuances of the fault, but also for slip rate calculations. In the northern section, the Hosgri fault diverges into two strands, running north and west around a central uplifted block—Piedras Blancas. Slip rate on the northerly strand is about 2.6 millimeters per year, but overall slip rate must be established on both strands. Slip rate likely varies along the Hosgri fault depending on whether adjacent faults are merging or diverging from the main fault. USGS is extending this detailed mapping north and south along the fault.

Southern California
More than 23 million people live in Southern California, and many more migrate there every year. Faults and earthquake threats in this region have been heavily studied on land. USGS aims to boost our knowledge about faults on the seafloor, so they can be included in hazard assessments.
Scientists did not collect highly detailed seafloor maps and seismic data beyond 25 miles off the coast of Southern California until 2008. The thinking was that faults beyond that distance would not affect U.S. coastlines, which turned out to be incorrect. Technology to map the seafloor in great detail was also very costly until the late 1990s.

The San Andreas fault is perhaps the best-known fault in Southern California. It’s part of a much larger system of faults generated by the Pacific and North American tectonic plates grinding past each other at a rate of about 50 millimeters a year. Other faults extending throughout Southern California also enable this boundary to move. Up to 20 percent of the movement occurs on offshore faults within 75 miles of the coast.
Earthquake probability forecasts didn’t even include faults located entirely offshore until 2014, despite the potential for these faults to generate destructive earthquakes. Research conducted by the USGS Coastal and Marine Geohazards group contributes directly to these forecasts, which help organizations set earthquake insurance rates, design building codes, and prepare for future seismic disasters in California.

The Pacific Northwest region, also known as Cascadia, extends over 500 million square miles from northern California north into Canada’s British Columbia and includes Washington, Oregon, and parts of Idaho, Montana, and southeast Alaska.
Cascadia is a tectonically active region, and the grand landscape reflects its geologic origins. It is part of the Earth’s famous “Ring of Fire,” created by subduction zone processes as Earth’s tectonic plates collide and move past each other. Volcanoes and earthquakes are characteristic features of subductions zones, and large-scale tectonic movements in subduction zones cause Earth’s largest earthquakes. The displacement and motion associated with these activities also generate tsunamis and landslides that can substantially alter the landscape, threaten human lives, and destroy infrastructure. Much of the evidence of this activity is in the sediments and structures that can be observed through marine geologic mapping in the offshore areas.

As part of a broader collaborative effort to advance subduction zone science and improve hazard assessment, USGS is working with partners to integrate multi-resolution geophysical imaging and geological sampling to characterize offshore margin morphology, including submarine landslides, sediment delivery systems, seafloor seeps, active faults, and upper plate velocity structure in Cascadia. Because uplift and subsidence associated with megathrust earthquakes often crosses the coastline, coordinated onshore-offshore synthesis is vital to this effort.
The geologic research and mapping in the offshore areas is foundational to understanding how to manage resources and improve public safety in subduction zone areas. This research is focused along major themes of understanding earthquake recurrence by looking at sedimentary records, looking for evidence of recent seafloor deformation and features that could generate tsunamis, and investigating deep marine seeps and fluids that may influence tectonic activity (as well as support unique ecosystems). The analyses are used to assess earthquake, tsunami, and landslide hazards, evaluate the risks they pose to society, and develop products that enhance situational awareness throughout the Cascadia region.

Research Highlight: Lacustrine Paleoseismology of Cascadia
The USGS has long been involved with deep-sea fault mapping, which typically uses a combination of sonar and sediment sampling to study faults offshore, often far beneath the seafloor. Applying similar techniques to lake sediments is a relatively new and growing field.
Scientists in the Coastal and Marine Geohazards project, along with partners and collaborators, are using an array of tools—from sonar and sediment sampling to computed tomography (CT) scanning and radiometric dating—to find evidence of past earthquakes in lakes across the tectonically active western U.S., from Alaska to Washington to Utah.

Over the last 100 years, the Queen Charlotte-Fairweather fault system has produced large-magnitude earthquakes affecting both Canada and the U.S. To fill in missing details about its offshore location and structure, USGS uses sophisticated techniques to fully understand the fault’s hazard potential.
The Queen Charlotte-Fairweather fault in southeastern Alaska is analogous to California’s San Andreas fault, both in length and type (strike-slip). Both faults form a boundary where two blocks of Earth’s crust—the North American and Pacific tectonic plates—slide horizontally past each other in opposite directions. The Queen Charlotte-Fairweather fault moves about 50 millimeters each year.

The Queen Charlotte-Fairweather fault extends 1,200 kilometers along southeastern Alaska and northern British Columbia, of which 900 kilometers lies offshore. During the past 120 years, the Queen Charlotte-Fairweather fault has generated six earthquakes of magnitude 7 or greater, including a magnitude 8.1 in 1949—Canada’s largest recorded earthquake. A magnitude 7.8 earthquake in 1958 triggered a landslide in Lituya Bay, leading to the largest tsunami run up ever recorded (1,720 feet up a mountainside). The populations of Juneau, Sitka, and other communities throughout southeastern Alaska continue to expand, and more than 1 million tourists visit each year to view and explore the region’s natural wonders, leaving many people vulnerable to its earthquake and tsunami hazards.
Relatively little is known about the Queen Charlotte-Fairweather fault and its associated geohazards, largely because it runs offshore. Aside from obtaining critical details about the fault’s structure, it is also crucial to determine if motion across this major plate boundary is distributed across one, two, or several faults.

Research Highlight: Geohazards of Prince William Sound and Southern Alaska
The USGS conducts chirp and sparker geophysical surveys in Prince William Sound and elsewhere in southern Alaska to search for submarine landslide deposits, which are a major tsunami hazard in the fjord regions. These deposits also provide a record of large earthquake recurrence.

Below are the current studies of the “U.S. West Coast and Alaska Marine Geohazards” Project.

Cascadia Subduction Zone Marine Geohazards

Seafloor Faults off Southern California

Offshore Faults along Central and Northern California

Underwater Landslides off Southern California

Hazards: EXPRESS

Earthquake Hazards in Southeastern Alaska
Coastal and marine geohazards are sudden and extreme events beneath the ocean that threaten coastal populations. These underwater hazards include earthquakes, volcanic eruptions, landslides, and tsunamis.
The tectonically active west coast of the Americas is prone to such hazards, as it lies along the boundaries of major tectonic plates that make up the Earth's crust—the North American, Caribbean, and South American Plates and the ocean plates to the west.
Along tectonic boundaries, sudden seafloor movement can cause significant damage to coastal communities.
Such hazards include shaking by large earthquakes in subduction zones, where one tectonic plate compresses another (examples include Cascadia and the Aleutian Trench); or on strike-slip faults, where one tectonic plate moves horizontally past another (such as in central and southern California). Related hazards include tsunamis generated by shifts in the seafloor or by underwater landslides that occur during earthquakes. Landslides can also threaten infrastructure on the ocean floor such as pipelines, communication cables, and oil platforms.
Understanding how different regions might be affected by coastal and marine geohazards is an important, yet complex problem. To assess risks of future geohazards, scientists in the USGS Coastal and Marine Geohazards group turn to the past for seismic evidence.
Scroll down to learn more or click the images below to jump to specific geographic settings covered by this research project.
Offshore Faults of California
Cascadia Subduction Zone
Offshore Faults of Southeast Alaska
People have been recording seismic activity for centuries. To assemble a detailed earthquake history of an area and understand how faults may behave in the future, however, scientists need to go further back in time—from several hundred to many thousands of years ago.
One barrier to accurately measuring seismic risk in coastal and marine settings has been the scarcity of high-resolution maps of the ocean floor. The technology for mapping large parts of the seafloor with enough detail needed to study offshore faults has only been available for about the last 30 years, long after coastal areas had been densely developed.
To better understand an offshore fault’s structure and behavior, USGS scientists go to sea to collect streams of data that they turn into comprehensive bathymetric and sub-bottom maps. This type of imaging, along with knowing the age of sediment along faults and measuring other factors such as magnetics and density, can help tell the story of when the fault last ruptured or how fast it’s moving. Using modern mapping and seismic technology to gather detailed seafloor data can directly impact human life and cities by improving earthquake and tsunami forecasts.
The USGS Coastal and Marine Geohazards team applies this technology to the seafloor offshore of several urban regions along the West Coast. For example, the San Francisco Bay Area has the highest density of active faults of any urban area in the nation; the densely populated expanse (approximately 23 million people) in southern California is threatened by the nation’s highest level of earthquake risk; and Alaska has had more large earthquakes than the rest of the U.S. combined. In addition, detailed imaging of the ocean bottom has uncovered new evidence of submarine landslides. Creating three-dimensional views of the seafloor down to depths of 12 kilometers has given scientists remarkable ways to examine how a fault works, or how fluids may follow underground paths and possibly trigger landslides.
Reassessing the threat of earthquake, tsunami, and landslide hazards to ports and nuclear power plants on the U.S. west coast can directly impact facility management, emergency-management planning, and plant re-licensing. The data can also affect building codes, the design of highways, bridges, and other large structures, as well as earthquake insurance rates.
Northern and Central California
The most significant faults within the plate boundary in central and northern California include the San Andreas, San Gregorio-Hosgri, and Hayward-Rodgers Creek fault zones. Each of these fault zones has important offshore sections that, until recently, were not mapped in great detail. For 300 kilometers between Pacifica and Cape Mendocino, about 60 percent of the trace of the San Andreas fault lies beneath the ocean floor. West of the San Andreas fault, the 400-kilometer-long San Gregorio-Hosgri fault extends primarily offshore between Point Conception and Bolinas, and sits within 3 nautical miles (in state waters) of the Diablo Canyon Power Plant. East of the San Andreas fault, the Hayward and Rodgers Creek faults are considered the most likely faults in the San Francisco Bay area to have a damaging (magnitude greater than 6.7) earthquake in the next 30 years.
The USGS is collecting higher-resolution offshore geophysical data to better characterize these faults. Scientists bounce sound off the seafloor to image the bottom (bathymetric mapping), or image the layers of sediment and rock beneath the seafloor (seismic mapping). For example, multibeam sonar and chirp systems both use high frequency sound to create detailed views, respectively, of the seafloor and features beneath the seafloor. Lower frequency sound sources, such as the mini-sparker, can penetrate deeper and image as much as 300 meters below the seafloor. In addition, detailed measurements of the Earth’s gravitational and magnetic fields near the seafloor can tell us about the physical properties of rocks on and below the seafloor, and help scientists locate and estimate the shape (dip) of the faults that cut those rocks.
Research Highlight: Hosgri Fault
USGS mapped the Hosgri fault zone in high-resolution for about 100 kilometers between Piedras Blancas and Point Sal in central California, where the fault runs within 3 nautical miles of the Diablo Canyon Power Plant. This comprehensive imaging helped highlight fault connections, which are important because longer faults can produce larger earthquakes. This level of detail also revealed the diversity of deformation along the fault, showing uplifts and depressions from small bends—a complexity not captured by previous mapping techniques. By using cutting-edge analysis, USGS scientists also examined seismic data in three dimensions along a fault bend in the Hosgri fault zone to help visualize the fault and spot pathways that fluids might follow.
Comprehensive mapping is important not only for capturing nuances of the fault, but also for slip rate calculations. In the northern section, the Hosgri fault diverges into two strands, running north and west around a central uplifted block—Piedras Blancas. Slip rate on the northerly strand is about 2.6 millimeters per year, but overall slip rate must be established on both strands. Slip rate likely varies along the Hosgri fault depending on whether adjacent faults are merging or diverging from the main fault. USGS is extending this detailed mapping north and south along the fault.
Southern California
More than 23 million people live in Southern California, and many more migrate there every year. Faults and earthquake threats in this region have been heavily studied on land. USGS aims to boost our knowledge about faults on the seafloor, so they can be included in hazard assessments.
Scientists did not collect highly detailed seafloor maps and seismic data beyond 25 miles off the coast of Southern California until 2008. The thinking was that faults beyond that distance would not affect U.S. coastlines, which turned out to be incorrect. Technology to map the seafloor in great detail was also very costly until the late 1990s.
The San Andreas fault is perhaps the best-known fault in Southern California. It’s part of a much larger system of faults generated by the Pacific and North American tectonic plates grinding past each other at a rate of about 50 millimeters a year. Other faults extending throughout Southern California also enable this boundary to move. Up to 20 percent of the movement occurs on offshore faults within 75 miles of the coast.
Earthquake probability forecasts didn’t even include faults located entirely offshore until 2014, despite the potential for these faults to generate destructive earthquakes. Research conducted by the USGS Coastal and Marine Geohazards group contributes directly to these forecasts, which help organizations set earthquake insurance rates, design building codes, and prepare for future seismic disasters in California.
The Pacific Northwest region, also known as Cascadia, extends over 500 million square miles from northern California north into Canada’s British Columbia and includes Washington, Oregon, and parts of Idaho, Montana, and southeast Alaska.
Cascadia is a tectonically active region, and the grand landscape reflects its geologic origins. It is part of the Earth’s famous “Ring of Fire,” created by subduction zone processes as Earth’s tectonic plates collide and move past each other. Volcanoes and earthquakes are characteristic features of subductions zones, and large-scale tectonic movements in subduction zones cause Earth’s largest earthquakes. The displacement and motion associated with these activities also generate tsunamis and landslides that can substantially alter the landscape, threaten human lives, and destroy infrastructure. Much of the evidence of this activity is in the sediments and structures that can be observed through marine geologic mapping in the offshore areas.
As part of a broader collaborative effort to advance subduction zone science and improve hazard assessment, USGS is working with partners to integrate multi-resolution geophysical imaging and geological sampling to characterize offshore margin morphology, including submarine landslides, sediment delivery systems, seafloor seeps, active faults, and upper plate velocity structure in Cascadia. Because uplift and subsidence associated with megathrust earthquakes often crosses the coastline, coordinated onshore-offshore synthesis is vital to this effort.
The geologic research and mapping in the offshore areas is foundational to understanding how to manage resources and improve public safety in subduction zone areas. This research is focused along major themes of understanding earthquake recurrence by looking at sedimentary records, looking for evidence of recent seafloor deformation and features that could generate tsunamis, and investigating deep marine seeps and fluids that may influence tectonic activity (as well as support unique ecosystems). The analyses are used to assess earthquake, tsunami, and landslide hazards, evaluate the risks they pose to society, and develop products that enhance situational awareness throughout the Cascadia region.
Research Highlight: Lacustrine Paleoseismology of Cascadia
The USGS has long been involved with deep-sea fault mapping, which typically uses a combination of sonar and sediment sampling to study faults offshore, often far beneath the seafloor. Applying similar techniques to lake sediments is a relatively new and growing field.
Scientists in the Coastal and Marine Geohazards project, along with partners and collaborators, are using an array of tools—from sonar and sediment sampling to computed tomography (CT) scanning and radiometric dating—to find evidence of past earthquakes in lakes across the tectonically active western U.S., from Alaska to Washington to Utah.
Over the last 100 years, the Queen Charlotte-Fairweather fault system has produced large-magnitude earthquakes affecting both Canada and the U.S. To fill in missing details about its offshore location and structure, USGS uses sophisticated techniques to fully understand the fault’s hazard potential.
The Queen Charlotte-Fairweather fault in southeastern Alaska is analogous to California’s San Andreas fault, both in length and type (strike-slip). Both faults form a boundary where two blocks of Earth’s crust—the North American and Pacific tectonic plates—slide horizontally past each other in opposite directions. The Queen Charlotte-Fairweather fault moves about 50 millimeters each year.
The Queen Charlotte-Fairweather fault extends 1,200 kilometers along southeastern Alaska and northern British Columbia, of which 900 kilometers lies offshore. During the past 120 years, the Queen Charlotte-Fairweather fault has generated six earthquakes of magnitude 7 or greater, including a magnitude 8.1 in 1949—Canada’s largest recorded earthquake. A magnitude 7.8 earthquake in 1958 triggered a landslide in Lituya Bay, leading to the largest tsunami run up ever recorded (1,720 feet up a mountainside). The populations of Juneau, Sitka, and other communities throughout southeastern Alaska continue to expand, and more than 1 million tourists visit each year to view and explore the region’s natural wonders, leaving many people vulnerable to its earthquake and tsunami hazards.
Relatively little is known about the Queen Charlotte-Fairweather fault and its associated geohazards, largely because it runs offshore. Aside from obtaining critical details about the fault’s structure, it is also crucial to determine if motion across this major plate boundary is distributed across one, two, or several faults.
Research Highlight: Geohazards of Prince William Sound and Southern Alaska
The USGS conducts chirp and sparker geophysical surveys in Prince William Sound and elsewhere in southern Alaska to search for submarine landslide deposits, which are a major tsunami hazard in the fjord regions. These deposits also provide a record of large earthquake recurrence.
Below are the current studies of the “U.S. West Coast and Alaska Marine Geohazards” Project.
Cascadia Subduction Zone Marine Geohazards
Seafloor Faults off Southern California
Offshore Faults along Central and Northern California
Underwater Landslides off Southern California
Hazards: EXPRESS