KW webcam image taken on December 21, 2020, just after 6:30 a.m. HST.
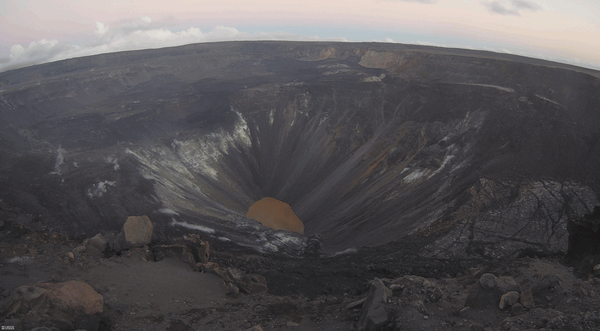
KW webcam image taken on December 21, 2020, just after 6:30 a.m. HST.Kīlauea summit KW webam image taken on December 21, 2020, just after 6:30 a.m. HST. The water lake, present until the evening of December 20, 2020, has been replaced by a lava lake; fissures in the wall of Halemaʻumaʻu feed a lava lake that continues to fill the crater.