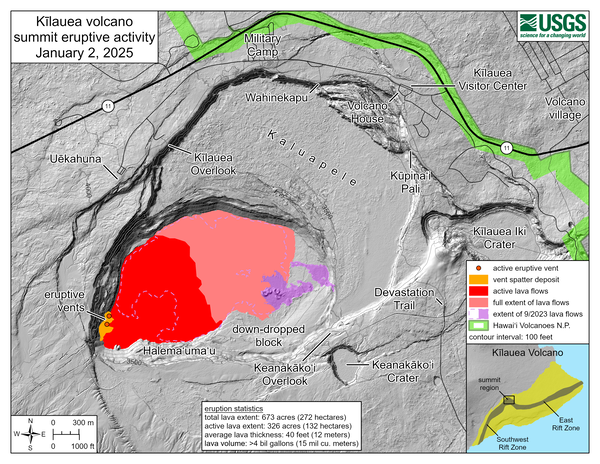
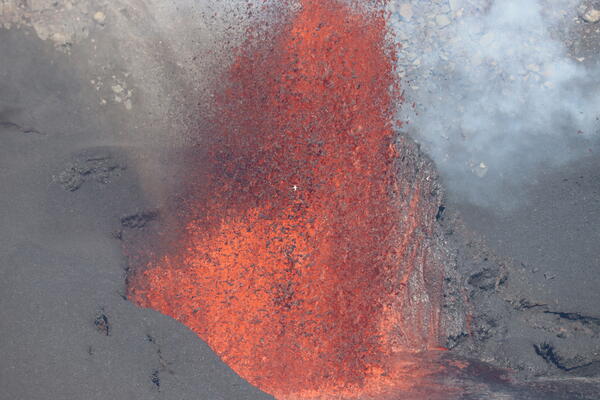
U.S. flag

An official website of the United States government

Images

Hawaiian Volcano Observatory images of eruptive activity, field work, and more.

Filter Total Items: 3867
Color photograph of scientist conducting maintenance on volcanic gas monitoring station
August 2, 2024—Sulfur Cone gas monitoring maintenance

A Hawaiian Volcano Observatory gas scientist works to install a newly calibrated Multi-Gas instrument at the Sulfur Cone site. At an elevation of 3,430 meters (11,240 feet) above sea level, the air is rare! Working conditions are far more strenuous for HVO field teams at these high elevations due to the much lower levels of oxygen in the air to breathe.

A Hawaiian Volcano Observatory gas scientist works to install a newly calibrated Multi-Gas instrument at the Sulfur Cone site. At an elevation of 3,430 meters (11,240 feet) above sea level, the air is rare! Working conditions are far more strenuous for HVO field teams at these high elevations due to the much lower levels of oxygen in the air to breathe.

Photo of volcanic cone
August 2, 2024—Sulfur Cone gas monitoring maintenance

On August 2,2024, Hawaiian Volcano Observatory Gas Scientists flew via helicopter to the Sulfur Cone Multi-Gas instrumentation site on Mauna Loa's Southwest Rift Zone, which is at an elevation of 3,430 meters (11,240 feet) above sea level.

On August 2,2024, Hawaiian Volcano Observatory Gas Scientists flew via helicopter to the Sulfur Cone Multi-Gas instrumentation site on Mauna Loa's Southwest Rift Zone, which is at an elevation of 3,430 meters (11,240 feet) above sea level.

Color photograph of volcanic gas monitoring instrumentation
August 2, 2024—Sulfur Cone gas monitoring maintenance

This photograph shows the inside of the Hawaiian Volcano Observatory (HVO) Multi-Gas site at Sulfur Cone. Currently, HVO has 2 of these continuous gas monitoring sites in operation on the Island of Hawai‘i. This one at Sulfur Cone high on Mauna Loa's Southwest Rift Zone, along with one at the summit of Kīlauea.

This photograph shows the inside of the Hawaiian Volcano Observatory (HVO) Multi-Gas site at Sulfur Cone. Currently, HVO has 2 of these continuous gas monitoring sites in operation on the Island of Hawai‘i. This one at Sulfur Cone high on Mauna Loa's Southwest Rift Zone, along with one at the summit of Kīlauea.

Color photograph of volcanic gas monitoring instrument
August 2, 2024—Sulfur Cone gas monitoring maintenance

The continuously monitoring Multi-Gas instrument at Sulfur Cone is housed inside the black Pelican case shown here. Air is pulled into the instrument via a small pump to be analyzed for volcanic gases (Sulfur Dioxide, Hydrogen Sulfide, Carbon Dioxide and Water Vapor).

The continuously monitoring Multi-Gas instrument at Sulfur Cone is housed inside the black Pelican case shown here. Air is pulled into the instrument via a small pump to be analyzed for volcanic gases (Sulfur Dioxide, Hydrogen Sulfide, Carbon Dioxide and Water Vapor).

Color photograph of scientist conducting maintenance on volcanic gas monitoring station
August 2, 2024—Sulfur Cone gas monitoring maintenance

A Hawaiian Volcano Observatory gas scientist works on installing a newly calibrated Multi-Gas instrument at the Sulfur Cone gas monitoring site high up on Mauna Loa's Southwest Rift Zone at an elevation of 3,430 meters (11,240 feet) above sea level. USGS photo by M. Cappos.

A Hawaiian Volcano Observatory gas scientist works on installing a newly calibrated Multi-Gas instrument at the Sulfur Cone gas monitoring site high up on Mauna Loa's Southwest Rift Zone at an elevation of 3,430 meters (11,240 feet) above sea level. USGS photo by M. Cappos.

Color photograph of volcanic gas monitoring instrumentation
August 2, 2024—Sulfur Cone gas monitoring maintenance

This photo shows the gas monitoring site layout at Sulfur Cone. On the left side of the photo is the power/telemetry system which powers the Multi-Gas instrument and sends data back to HVO via radio to be later analyzed by HVO gas scientists.

This photo shows the gas monitoring site layout at Sulfur Cone. On the left side of the photo is the power/telemetry system which powers the Multi-Gas instrument and sends data back to HVO via radio to be later analyzed by HVO gas scientists.

Color photographs of student in lab, in the field, and presenting
2024 HVO PIPES intern Kamalani Poepoe

Left: 2024 HVO PIPES intern Kamalani Poepoe and colleagues prepare samples from Kīlauea’s June 2024 eruption for analysis. Top Right: Kamalani gets instruction on how to perform eruption response tasks on the rim of Halemaʻumaʻu. Lower Right: Kamalani presenting her work at the 2024 PIPES symposium in Honolulu, HI. 

Left: 2024 HVO PIPES intern Kamalani Poepoe and colleagues prepare samples from Kīlauea’s June 2024 eruption for analysis. Top Right: Kamalani gets instruction on how to perform eruption response tasks on the rim of Halemaʻumaʻu. Lower Right: Kamalani presenting her work at the 2024 PIPES symposium in Honolulu, HI. 

Color plots of seismic data
Example waveforms of HVO seismic data

Figure caption: Example waveforms showing a T-phase arriving from the M7.4 Chile earthquake on July 19, 2024 (left).  This T-phase event is compared to a local tremor burst deep beneath Pāhala on July 30, 2024 (right).  The plots show time for several stations in the HVO network.  The T-phase moves more slowly across the network which is represented b

Figure caption: Example waveforms showing a T-phase arriving from the M7.4 Chile earthquake on July 19, 2024 (left).  This T-phase event is compared to a local tremor burst deep beneath Pāhala on July 30, 2024 (right).  The plots show time for several stations in the HVO network.  The T-phase moves more slowly across the network which is represented b

Black and white image showing location of volcanoes and infrastructure on an island
Map of volcanoes and infrastructure on the Island of Hawaiʻi

Map of Island of Hawaiʻi, highlighting the four active or potentially active volcanoes of the Island, the number of people living on each volcano based on 2020 census data, major roads (transportation corridors) and minor roads (proxy for population density), when each volcano last erupted, and each volcano’s national threat assessment designation.

Map of Island of Hawaiʻi, highlighting the four active or potentially active volcanoes of the Island, the number of people living on each volcano based on 2020 census data, major roads (transportation corridors) and minor roads (proxy for population density), when each volcano last erupted, and each volcano’s national threat assessment designation.

Color map showing ground deformation and earthquakes at a volcano
July 25, 2024—Kīlauea upper East Rift Zone unrest

This reference map depicts recent unrest along Kīlauea's upper East Rift Zone. Earthquakes that occurred between July 22–25, 2024, are shown as yellow circles. Recent ground deformation in this region, over the timeframe of July 15-24, 2024, is shown as colored fringes; data were recorded by the Italian Space Agency's (ASI) Cosmo-SkyMED satellite.

This reference map depicts recent unrest along Kīlauea's upper East Rift Zone. Earthquakes that occurred between July 22–25, 2024, are shown as yellow circles. Recent ground deformation in this region, over the timeframe of July 15-24, 2024, is shown as colored fringes; data were recorded by the Italian Space Agency's (ASI) Cosmo-SkyMED satellite.

Crack on a road
July 25, 2024 — Crack growth on Chain of Craters Road

On July 25, USGS-Hawaiian Volcano Observatory (HVO) staff again drove down the closed portion of Chain of Craters Road in Hawaiʻi Volcanoes National Park to check for any damage related to the July 22-25 intrusion on Kīlauea's upper East Rift Zone. They found many new small cracks in Chain of Craters Road, including this one, near Hiʻiaka Crater.

On July 25, USGS-Hawaiian Volcano Observatory (HVO) staff again drove down the closed portion of Chain of Craters Road in Hawaiʻi Volcanoes National Park to check for any damage related to the July 22-25 intrusion on Kīlauea's upper East Rift Zone. They found many new small cracks in Chain of Craters Road, including this one, near Hiʻiaka Crater.

Color map showing ground deformation of volcano
July 24, 2024—InSAR image of Kīlauea ground deformation

This map shows recent deformation at Kīlauea, over the timeframe of July 15-24, 2024. Data were recorded by the Italian Space Agency's (ASI) Cosmo-SkyMED satellite. Colored fringes denote areas of ground deformation, with more fringes indicating more deformation.  Each color cycle represents 1.5 cm (0.6 in) of ground motion.

This map shows recent deformation at Kīlauea, over the timeframe of July 15-24, 2024. Data were recorded by the Italian Space Agency's (ASI) Cosmo-SkyMED satellite. Colored fringes denote areas of ground deformation, with more fringes indicating more deformation.  Each color cycle represents 1.5 cm (0.6 in) of ground motion.

Color photograph of scientist standing near road
July 23, 2024 — Small cracks on Chain of Craters Road

On July 23, USGS-Hawaiian Volcano Observatory (HVO) staff drove down the closed portion of Chain of Craters Road in Hawaiʻi Volcanoes National Park to check for any damage related to the July 22-25 intrusion on Kīlauea's upper East Rift Zone.

On July 23, USGS-Hawaiian Volcano Observatory (HVO) staff drove down the closed portion of Chain of Craters Road in Hawaiʻi Volcanoes National Park to check for any damage related to the July 22-25 intrusion on Kīlauea's upper East Rift Zone.

Color photograph of ground deformation at a volcano
July 8, 2024—InSAR image of Kīlauea ground deformation

This map shows recent deformation at Kīlauea, over the timeframe of June 6 to July 8, 2024. Data was recorded by the Italian Space Agency's (ASI) Cosmo-SkyMED satellite. Colored fringes denote areas of ground deformation, with more fringes indicating more deformation.  Each color cycle represents 1.5 cm (0.6 in) of ground motion.

This map shows recent deformation at Kīlauea, over the timeframe of June 6 to July 8, 2024. Data was recorded by the Italian Space Agency's (ASI) Cosmo-SkyMED satellite. Colored fringes denote areas of ground deformation, with more fringes indicating more deformation.  Each color cycle represents 1.5 cm (0.6 in) of ground motion.

Color map showing the location that people reported earthquakes and with color denoting the intensity of shaking
The CIIM for the magnitude-4.1 earthquake on July 6, 2024, on the Island of Hawaiʻi

The Community Internet Intensity Map for the magnitude-4.1 earthquake on July 6, 2024, on the Island of Hawaiʻi (location shown by star). Felt reports show the intensity of shaking during the earthquake across the Island of Hawaiʻi. Not shown are felt reports from Maui and Lanaʻi for this event. 

The Community Internet Intensity Map for the magnitude-4.1 earthquake on July 6, 2024, on the Island of Hawaiʻi (location shown by star). Felt reports show the intensity of shaking during the earthquake across the Island of Hawaiʻi. Not shown are felt reports from Maui and Lanaʻi for this event. 

Color photograph of sulfur crystals in ground crack
July 3, 2024 — Sulfur crystals on Kīlauea

A close up view of delicate sulfur crystals in one of the cracks near the June 3 eruption site, on Kīlauea. USGS photo by M. Patrick.

A close up view of delicate sulfur crystals in one of the cracks near the June 3 eruption site, on Kīlauea. USGS photo by M. Patrick.

Color photograph of thermal area on volcano
Puhimau thermal area

View of the broomsedge grass in the Puhimau thermal area on the upper East Rift Zone of Kīlauea. The Puhimau thermal area is apparent on both sides of Chain of Craters Road in Hawaiʻi Volcanoes National Park. USGS image by K. Mulliken. 

View of the broomsedge grass in the Puhimau thermal area on the upper East Rift Zone of Kīlauea. The Puhimau thermal area is apparent on both sides of Chain of Craters Road in Hawaiʻi Volcanoes National Park. USGS image by K. Mulliken. 

Color photograph of field engineer adjusting volcano-monitoring instrument
July 2, 2024 — Leveling the UWE tiltmeter at the summit of Kīlauea

Once the sand was removed from the borehole, HVO field engineers could begin the process of leveling the UWE tiltmeter located at the base.

Color photograph of webcam on lava flow
July 3, 2024 — Shifting webcam locations on Kīlauea's Southwest Rift Zone

HVO geologists visited Kīlauea's Southwest Rift Zone and site of the June 3 eruption. The mission was to remove the temporary webcams deployed during that eruption, given a new temporary webcam nearby on Cone Peak. This photo shows the temporary webcam removed today near the June 3 eruption site. USGS photo by M. Patrick.

HVO geologists visited Kīlauea's Southwest Rift Zone and site of the June 3 eruption. The mission was to remove the temporary webcams deployed during that eruption, given a new temporary webcam nearby on Cone Peak. This photo shows the temporary webcam removed today near the June 3 eruption site. USGS photo by M. Patrick.

Color photograph of ground cracks and sulfur deposits
July 3, 2024 — Ground cracks and sulfur deposits on the Southwest Rift Zone of Kīlauea

While HVO geologists were moving temporary webcams, they revisited the site of the June 3 eruption. This photo looks downrift, with the June 3 pad of lava in the upper right. Extensive cracking uprift of the fissure had weak residual outgassing and vibrant sulfur deposits. USGS photo by M. Patrick.

While HVO geologists were moving temporary webcams, they revisited the site of the June 3 eruption. This photo looks downrift, with the June 3 pad of lava in the upper right. Extensive cracking uprift of the fissure had weak residual outgassing and vibrant sulfur deposits. USGS photo by M. Patrick.

Was this page helpful?