High-resolution Planet satellite image of Biscuit Basin, Yellowstone National Park, from July 21, 2024
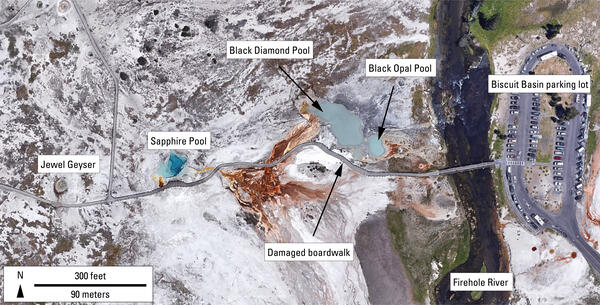
High-resolution Planet satellite image of Biscuit Basin, Yellowstone National Park, from July 21, 2024High-resolution Planet satellite image of Biscuit Basin, Yellowstone National Park, from July 21, 2024. This work utilized data made available through the NASA Commercial Smallsat Data Acquisition (CSDA) Program. Data are copyright, Planet Labs Inc. 2024, all rights reserved.