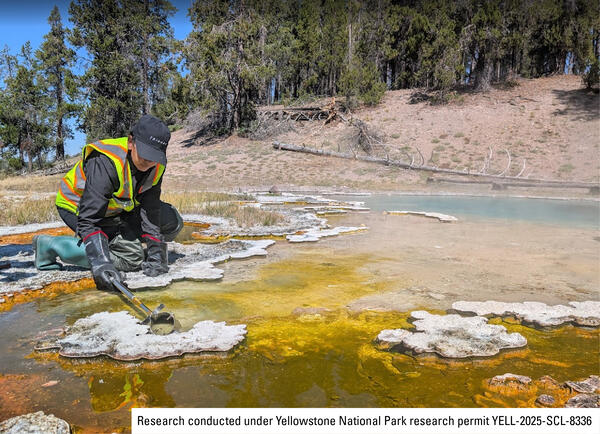
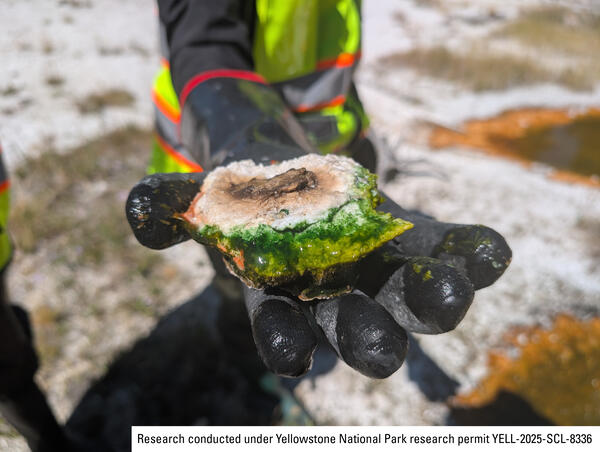
Simplified schematic of a volcanic plume ejecting ash, crystals and fragments of rock from a vent. This rising plume will eventually hit a zone of neutral buoyancy in the atmosphere, where it is then carried by the wind. Material is ejected from both the upward moving jet and falls from the umbrellaing plume.
Images
Images related to Yellowstone Volcano Observatory.
Simplified schematic of a volcanic plume ejecting ash, crystals and fragments of rock from a vent. This rising plume will eventually hit a zone of neutral buoyancy in the atmosphere, where it is then carried by the wind. Material is ejected from both the upward moving jet and falls from the umbrellaing plume.
Map of Roadside Springs thermal area, Yellowstone National Park
Map of Roadside Springs thermal area, Yellowstone National ParkMap showing the Roadside Springs thermal area, located just north of Nymph Lake along the Norris-Mammoth highway. Hydrothermal ground is shaded purple. New hydrothermal features formed in 2003 on the north side of Nymph Lake, and also in 2024 a bit further north from the lake. Figure by Jefferson Hungerford, Yellowstone National Park.
Aerial view of Roadside Springs thermal area, Yellowstone National Park
Aerial view of Roadside Springs thermal area, Yellowstone National ParkAerial view looking to the west at the Roadside Springs hydrothermal area and Nymph Lake showing the locations of thermal features that formed in 2003 and 2024. Yellow line marks the Mammoth-Norris highway. Figure by Jefferson Hungerford, Yellowstone National Park.
Map of the Northwestern United States showing major volcanic features associated with the Yellowstone mantle plume
Map of the Northwestern United States showing major volcanic features associated with the Yellowstone mantle plumeMap of the Northwestern United States showing major volcanic features associated with the mantle plume currently underneath Yellowstone caldera. Colors indicate general basaltic (blues) versus rhyolitic (reds) compositions, with shades indicating age (darker shades are older). Rough outlines of calderas that formed due to the Yellowstone hotspot are give
Geologic domains of the Greater Yellowstone Ecosystem
Geologic domains of the Greater Yellowstone EcosystemMap of the geologic domains of the Greater Yellowstone Ecosystem (GYE). Boundaries are approximate.
Geologic domains of the Greater Yellowstone Ecosystem
Geologic domains of the Greater Yellowstone EcosystemMap of the geologic domains of the Greater Yellowstone Ecosystem (GYE). Boundaries are approximate.
Organizational chart for the Yellowstone Volcano Observatory in the event of a response to a geological hazard
Organizational chart for the Yellowstone Volcano Observatory in the event of a response to a geological hazardOrganization chart giving the structure of a response by the Yellowstone Volcano Observatory to a significant episode of unrest or eruption at the Yellowstone volcanic system. The strategy is scalable (elements are activated as they are needed and deactivated when they are no longer needed) and can be adapted to meet the needs of the event response.
Schematic showing magma storage beneath Yellowstone caldera based on magnetotelluric data
Schematic showing magma storage beneath Yellowstone caldera based on magnetotelluric dataSchematic showing magma storage beneath Yellowstone caldera. Nested calderas resulting from the Huckleberry Ridge Tuff, Mesa Falls Tuff, and Lava Creek Tuff caldera forming eruptions are shown as solid black, green, and orange lines, respectively.
Map of earthquakes in the Yellowstone National Park region in 2024
Map of earthquakes in the Yellowstone National Park region in 2024Map of seismicity (red circles) in the Yellowstone region during 2024. Gray lines are roads, black dashed line shows the caldera boundary, Yellowstone National Park is outlined by black dot-dashed line, and gray dashed lines denote state boundaries.
Comparison of steep subduction and flat-slab subduction
Comparison of steep subduction and flat-slab subductionComparison of steep subduction (like that occurring today beneath the Pacific Northwest of the United States) and flat-slab subduction (which led to the formation of the Rocky Mountains a few tens of millions of years ago). Black arrows indicate the relative direction of movement of the oceanic plate.
This example shows areas where seismic waves travel more quickly in blue, and slower areas in red, beneath the western United States. Faults are black lines, and blue line is the San Andreas Fault.
Photoscans and computed tomography of sediment cores from Henrys Lake, Idaho
Photoscans and computed tomography of sediment cores from Henrys Lake, IdahoTransect of sediment cores from Henrys Lake, Idaho. (a) High‐resolution photoscans and computed tomography (CT) of each core correspond to the location tie line. White line on CT represents gamma ray attenuation bulk density (g/cc). Mapped facies are right of each correspondent core. Shades of gray represent background sedimentation and the event deposit by orange.
Photo and cartoon of 1959 Hebgen Lake earthquake deposit in Henrys Lake (ID) sediment core, along with Cesium-137 levels
Photo and cartoon of 1959 Hebgen Lake earthquake deposit in Henrys Lake (ID) sediment core, along with Cesium-137 levelsPhoto and cartoon of 1959 Hebgen Lake earthquake deposit in sediment core from Henrys Lake, Idaho, with references to Cesium-137 activity (or concentration). Changes in Cesium-137 are related to atmospheric nuclear tests and provide a means of dating the deposit; those measurements are plotted on the right with depth (in cm) of the core.
Map of thermal areas in Yellowstone National Park (2024)
Map of thermal areas in Yellowstone National Park (2024)Map of thermal areas from ground-based mapping and remote-sensing methods compiled by Vaughn et al., 2024 (https://www.sciencebase.gov/catalog/item/661d5eb7d34e7eb9eb7e3a41).
Map of thermal areas in Yellowstone National Park (2024)
Map of thermal areas in Yellowstone National Park (2024)Map of thermal areas from ground-based mapping and remote-sensing methods compiled by Vaughn et al., 2024 (https://www.sciencebase.gov/catalog/item/661d5eb7d34e7eb9eb7e3a41).
Hazy conditions caused by sulfur dioxide emissions from Kīlauea, Hawai‘i
Hazy conditions caused by sulfur dioxide emissions from Kīlauea, Hawai‘iHazy conditions caused by sulfur dioxide (SO2) emissions from Halema‘uma‘u crater, Kīlauea, Hawai‘i. USGS photo by Jennifer Lewicki, December 25, 2024.
Hazy conditions caused by sulfur dioxide emissions from Kīlauea, Hawai‘i
Hazy conditions caused by sulfur dioxide emissions from Kīlauea, Hawai‘iHazy conditions caused by sulfur dioxide (SO2) emissions from Halema‘uma‘u crater, Kīlauea, Hawai‘i. USGS photo by Jennifer Lewicki, December 25, 2024.
Modern vegetation on different geological substrates in Yellowstone
Modern vegetation on different geological substrates in YellowstoneModern vegetation on different geological substrates in Yellowstone. Left: steppe/grassland on glacial clay found in places like Lamar and Hayden Valleys. Center: Mixed conifer forest in the Absaroka andesite volcanic field in the eastern part of Yellowstone National Park. Right: Lodgepole pine forest on Central Plateau rhyolite (hydrothermal grass
Vegetation history based on pollen records from three small lakes on different geological substrates in Yellowstone National Park
Vegetation history based on pollen records from three small lakes on different geological substrates in Yellowstone National ParkVegetation history based on pollen records from three small lakes on different geological substrates in Yellowstone National Park. Blue is open vegetation, light green is parkland, dark green is forest. Top plot is from Slough Creek Pond, in a present grassland area dominated by glacial and lake sediment in the northeast part of Yellowstone Nationa
Graphic showing how InSAR detects ground deformation
Graphic showing how InSAR detects ground deformationGraphic showing how InSAR detects ground deformation by measuring changes in the signal that bounces off the Earth. Figure by the EarthScope Consortium.
Graphic showing how InSAR detects ground deformation
Graphic showing how InSAR detects ground deformationGraphic showing how InSAR detects ground deformation by measuring changes in the signal that bounces off the Earth. Figure by the EarthScope Consortium.
Bathymetric map of the West Thumb Basin, Yellowstone National Park
Bathymetric map of the West Thumb Basin, Yellowstone National ParkBathymetric map of the West Thumb Basin showing numerous mapped active or inactive hydrothermal vent sites (small white circles) and sampled hot springs (white stars or larger white circles) and sediment cores (yellow diamonds). The white-black line represents the 160,000-year-old West Thumb Caldera margin. West Thumb Geyser Basin is near the southern en
Schematic summary of rhyolite eruptions in the Yellowstone Plateau volcanic field over the past 1.3 million years
Schematic summary of rhyolite eruptions in the Yellowstone Plateau volcanic field over the past 1.3 million yearsSchematic summary of rhyolite eruptions in the Yellowstone Plateau volcanic field over the past 1.3 million years. Smaller rhyolite eruptions are known intracaldera eruptions, meaning they occurred within existing caldera structures. Additional rhyolite eruptions that occurred outside the caldera are not included in the figure.
Benchmark C9, near Apollinaris Spring in Yellowstone National Park
Benchmark C9, near Apollinaris Spring in Yellowstone National ParkBenchmark C9, installed by the US Coast and Geodetic Survey (now the National Geodetic Survey) in 1923 near Apollinaris Spring in Yellowstone National Park. The number stamped into the mark, “7337.580,” is the elevation in feet that was determined by surveys the year the benchmark was established. USGS photo by Michael Poland, September 4, 2024.
Satellite images of Nupahr Lake, Norris Geyser Basin, in 2024
Satellite images of Nupahr Lake, Norris Geyser Basin, in 2024High-resolution satellite images of Norris Geyser Basin showing the area of Porcelain Basin and Nuphar Lake (both images cover the same area). In the left image, acquired on April 2, 2024, springs on Porcelain Terrace are full of water, and warm hydrothermal water is flowing into Nuphar Lake from the area circled in yellow. This warm water kept the north