
This example shows areas where seismic waves travel more quickly in blue, and slower areas in red, beneath the western United States. Faults are black lines, and blue line is the San Andreas Fault.
Images
Images related to Yellowstone Volcano Observatory.
Filter Total Items: 761

Example of a seismic tomography model
This example shows areas where seismic waves travel more quickly in blue, and slower areas in red, beneath the western United States. Faults are black lines, and blue line is the San Andreas Fault.
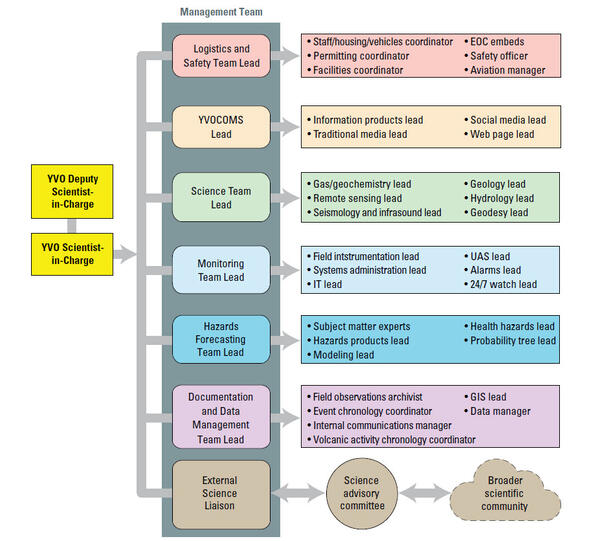
Organizational chart for the Yellowstone Volcano Observatory in the event of a response to a geological hazard
Organizational chart for the Yellowstone Volcano Observatory in the event of a response to a geological hazardOrganization chart giving the structure of a response by the Yellowstone Volcano Observatory to a significant episode of unrest or eruption at the Yellowstone volcanic system. The strategy is scalable (elements are activated as they are needed and deactivated when they are no longer needed) and can be adapted to meet the needs of the event response.

Photo and cartoon of 1959 Hebgen Lake earthquake deposit in Henrys Lake (ID) sediment core, along with Cesium-137 levels
Photo and cartoon of 1959 Hebgen Lake earthquake deposit in Henrys Lake (ID) sediment core, along with Cesium-137 levelsPhoto and cartoon of 1959 Hebgen Lake earthquake deposit in sediment core from Henrys Lake, Idaho, with references to Cesium-137 activity (or concentration). Changes in Cesium-137 are related to atmospheric nuclear tests and provide a means of dating the deposit; those measurements are plotted on the right with depth (in cm) of the core.

Map of thermal areas in Yellowstone National Park (2024)
Map of thermal areas in Yellowstone National Park (2024)Map of thermal areas from ground-based mapping and remote-sensing methods compiled by Vaughn et al., 2024 (https://www.sciencebase.gov/catalog/item/661d5eb7d34e7eb9eb7e3a41).
Map of thermal areas in Yellowstone National Park (2024)
Map of thermal areas in Yellowstone National Park (2024)Map of thermal areas from ground-based mapping and remote-sensing methods compiled by Vaughn et al., 2024 (https://www.sciencebase.gov/catalog/item/661d5eb7d34e7eb9eb7e3a41).

Photoscans and computed tomography of sediment cores from Henrys Lake, Idaho
Photoscans and computed tomography of sediment cores from Henrys Lake, IdahoTransect of sediment cores from Henrys Lake, Idaho. (a) High‐resolution photoscans and computed tomography (CT) of each core correspond to the location tie line. White line on CT represents gamma ray attenuation bulk density (g/cc). Mapped facies are right of each correspondent core. Shades of gray represent background sedimentation and the event deposit by orange.
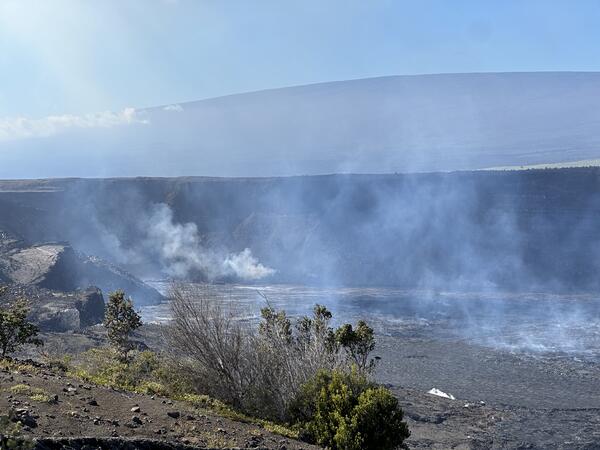
Hazy conditions caused by sulfur dioxide emissions from Kīlauea, Hawai‘i
Hazy conditions caused by sulfur dioxide emissions from Kīlauea, Hawai‘iHazy conditions caused by sulfur dioxide (SO2) emissions from Halema‘uma‘u crater, Kīlauea, Hawai‘i. USGS photo by Jennifer Lewicki, December 25, 2024.
Hazy conditions caused by sulfur dioxide emissions from Kīlauea, Hawai‘i
Hazy conditions caused by sulfur dioxide emissions from Kīlauea, Hawai‘iHazy conditions caused by sulfur dioxide (SO2) emissions from Halema‘uma‘u crater, Kīlauea, Hawai‘i. USGS photo by Jennifer Lewicki, December 25, 2024.

Modern vegetation on different geological substrates in Yellowstone
Modern vegetation on different geological substrates in YellowstoneModern vegetation on different geological substrates in Yellowstone. Left: steppe/grassland on glacial clay found in places like Lamar and Hayden Valleys. Center: Mixed conifer forest in the Absaroka andesite volcanic field in the eastern part of Yellowstone National Park. Right: Lodgepole pine forest on Central Plateau rhyolite (hydrothermal grass

Vegetation history based on pollen records from three small lakes on different geological substrates in Yellowstone National Park
Vegetation history based on pollen records from three small lakes on different geological substrates in Yellowstone National ParkVegetation history based on pollen records from three small lakes on different geological substrates in Yellowstone National Park. Blue is open vegetation, light green is parkland, dark green is forest. Top plot is from Slough Creek Pond, in a present grassland area dominated by glacial and lake sediment in the northeast part of Yellowstone Nationa

Graphic showing how InSAR detects ground deformation
Graphic showing how InSAR detects ground deformationGraphic showing how InSAR detects ground deformation by measuring changes in the signal that bounces off the Earth. Figure by the EarthScope Consortium.
Graphic showing how InSAR detects ground deformation
Graphic showing how InSAR detects ground deformationGraphic showing how InSAR detects ground deformation by measuring changes in the signal that bounces off the Earth. Figure by the EarthScope Consortium.

Bathymetric map of the West Thumb Basin, Yellowstone National Park
Bathymetric map of the West Thumb Basin, Yellowstone National ParkBathymetric map of the West Thumb Basin showing numerous mapped active or inactive hydrothermal vent sites (small white circles) and sampled hot springs (white stars or larger white circles) and sediment cores (yellow diamonds). The white-black line represents the 160,000-year-old West Thumb Caldera margin. West Thumb Geyser Basin is near the southern en

Schematic summary of rhyolite eruptions in the Yellowstone Plateau volcanic field over the past 1.3 million years
Schematic summary of rhyolite eruptions in the Yellowstone Plateau volcanic field over the past 1.3 million yearsSchematic summary of rhyolite eruptions in the Yellowstone Plateau volcanic field over the past 1.3 million years. Smaller rhyolite eruptions are known intracaldera eruptions, meaning they occurred within existing caldera structures. Additional rhyolite eruptions that occurred outside the caldera are not included in the figure.

Benchmark C9, near Apollinaris Spring in Yellowstone National Park
Benchmark C9, near Apollinaris Spring in Yellowstone National ParkBenchmark C9, installed by the US Coast and Geodetic Survey (now the National Geodetic Survey) in 1923 near Apollinaris Spring in Yellowstone National Park. The number stamped into the mark, “7337.580,” is the elevation in feet that was determined by surveys the year the benchmark was established. USGS photo by Michael Poland, September 4, 2024.

Satellite images of Nupahr Lake, Norris Geyser Basin, in 2024
Satellite images of Nupahr Lake, Norris Geyser Basin, in 2024High-resolution satellite images of Norris Geyser Basin showing the area of Porcelain Basin and Nuphar Lake (both images cover the same area). In the left image, acquired on April 2, 2024, springs on Porcelain Terrace are full of water, and warm hydrothermal water is flowing into Nuphar Lake from the area circled in yellow. This warm water kept the north

New steam vent that formed in 2024 near Nymph Lake, Yellowstone National Park
New steam vent that formed in 2024 near Nymph Lake, Yellowstone National ParkNew steam vent at the base of a hill north of Nymph Lake, west of the highway and between Norris Geyser Basin and Roaring Mountain. USGS photo by Mike Poland, September 1, 2024.
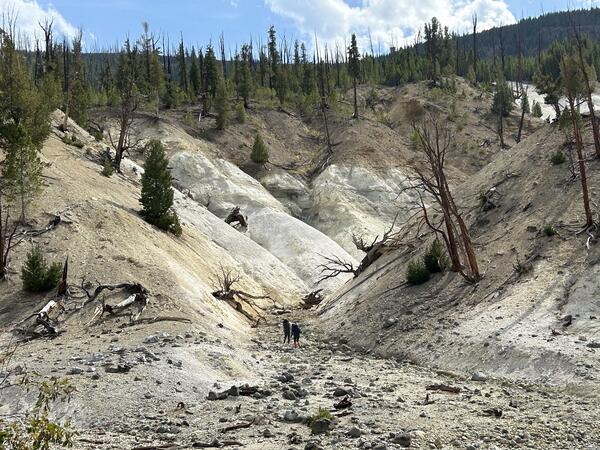
Death Gulch, Yellowstone National Park
USGS scientists equipped with gas masks and monitors exploring Death Gulch. Photo by Shaul Hurwitz, September 2024.
USGS scientists equipped with gas masks and monitors exploring Death Gulch. Photo by Shaul Hurwitz, September 2024.
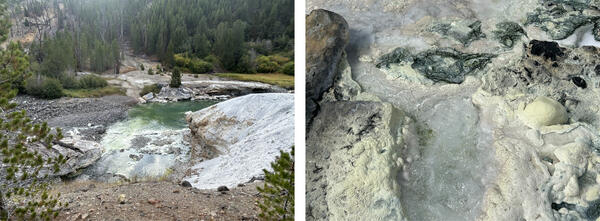
Wahb Springs, Yellowstone National Park
Wahb Springs in Yellowstone National Park. Left: zoomed-out photo of the springs (photo by David Roth, September 2024). Right: close-up photo showing the unique organic material floating on the spring water (photo by Shaul Hurwitz, September 2024).
Wahb Springs in Yellowstone National Park. Left: zoomed-out photo of the springs (photo by David Roth, September 2024). Right: close-up photo showing the unique organic material floating on the spring water (photo by Shaul Hurwitz, September 2024).

new thermal feature that formed in 2024 near Nymph Lake, Yellowstone National Park
new thermal feature that formed in 2024 near Nymph Lake, Yellowstone National ParkLooking south from near a pullout along the Mammoth to Norris road just north of the Nymph Lake overlook. On the other side of the marsh is a tree-covered rhyolite lava flow, and at the base of the flow is a new thermal feature marked by a plume of steam and that formed in early August 2024. Photo by Mike Poland, USGS, September 1, 2024.

Dead trees along the edge of Nuphar Lake, Yellowstone National Park, in summer 2024
Dead trees along the edge of Nuphar Lake, Yellowstone National Park, in summer 2024Photo of dead trees along the edge of Nuphar Lake. The white staining at the base of the trees is a telltale sign that the trees were immersed in thermal water containing silica. USGS photo by Mike Poland, September 1, 2024.
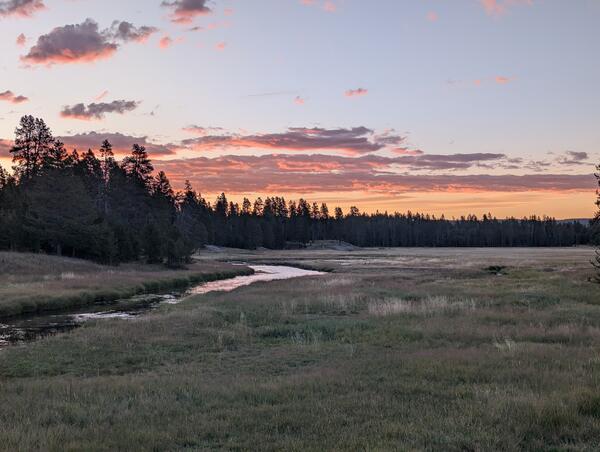
Gibbon River near Norris Geyser Basin in Yellowstone National Park
Gibbon River near Norris Geyser Basin in Yellowstone National ParkGibbon River near Norris Geyser Basin in Yellowstone National Park at sunset. USGS Photo by Mike Poland, August 28, 2024.
Gibbon River near Norris Geyser Basin in Yellowstone National Park
Gibbon River near Norris Geyser Basin in Yellowstone National ParkGibbon River near Norris Geyser Basin in Yellowstone National Park at sunset. USGS Photo by Mike Poland, August 28, 2024.

Geologist examining Lava Creek Tuff ash fall beds near Shell, Wyoming
Geologist examining Lava Creek Tuff ash fall beds near Shell, WyomingProfessor C.J.N. Wilson, FRS, pays due homage to the Lava Creek Tuff ashfall bed in a basin just east of Shell, Wyoming. Photo by Madison Myers, Montana State University, August 9, 2024.

USGS response to Tropical Storm Debby in Georgia
Drew Robinson, a USGS hydrological technician, is putting a Rapid Deployment Gauge together for the Georgia Department of Transportation on Wednesday, August 7. He built the RDG and deployed it in Statesboro in the early evening. That RDG was used to help the local community experiencing bad floods on Lotts Creek.
Drew Robinson, a USGS hydrological technician, is putting a Rapid Deployment Gauge together for the Georgia Department of Transportation on Wednesday, August 7. He built the RDG and deployed it in Statesboro in the early evening. That RDG was used to help the local community experiencing bad floods on Lotts Creek.