



James Molden shows off an Orange-throated Whiptail (Aspidoscelis hyperythra) while conducting the monthly pitfall trap monitoring at Cabrillo National Monument. The traps were put in place over 20 years ago by researcher Robert Fisher. USGS is looking at the effects of fragmentation on the isolated amphibian and reptile community at the monument.
All Multimedia
Access all multimedia to include images, video, audio, webcams, before-after imagery, and more. Filter and explore with filtering options to refine search.
Filter Total Items: 24981

Orange-throated Whiptail lizard gets a ride
James Molden shows off an Orange-throated Whiptail (Aspidoscelis hyperythra) while conducting the monthly pitfall trap monitoring at Cabrillo National Monument. The traps were put in place over 20 years ago by researcher Robert Fisher. USGS is looking at the effects of fragmentation on the isolated amphibian and reptile community at the monument.

Photographs from a Common Eider (Somateria mollissima)
Photographs from a Common Eider (Somateria mollissima)Photographs from a Common Eider (Somateria mollissima) from Massachusetts, USA. (A) There are scattered, small, pale foci in the liver. (B) Petechial and ecchymotic hemorrhages are present in the pancreas.
Photographs from a Common Eider (Somateria mollissima)
Photographs from a Common Eider (Somateria mollissima)Photographs from a Common Eider (Somateria mollissima) from Massachusetts, USA. (A) There are scattered, small, pale foci in the liver. (B) Petechial and ecchymotic hemorrhages are present in the pancreas.
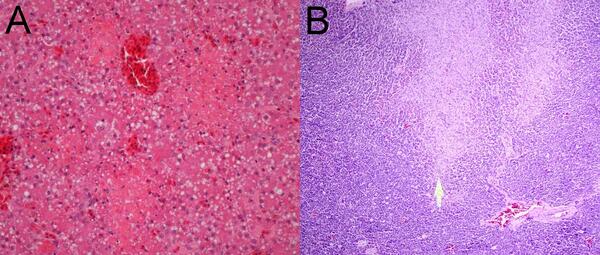
Photomicrographs from a Common Eider (Somateria mollissima)
Photomicrographs from a Common Eider (Somateria mollissima)Photomicrographs from a Common Eider (Somateria mollissima) from Massachusetts, USA. (A) Multiple pale foci of acute hepatic necrosis. (B) Multiple foci of acute pancreatic necrosis (arrow).
Photomicrographs from a Common Eider (Somateria mollissima)
Photomicrographs from a Common Eider (Somateria mollissima)Photomicrographs from a Common Eider (Somateria mollissima) from Massachusetts, USA. (A) Multiple pale foci of acute hepatic necrosis. (B) Multiple foci of acute pancreatic necrosis (arrow).

Streamflow measurement in S Fk Spread Creek, WY (13012475)
Streamflow measurement in S Fk Spread Creek, WY (13012475)Streamflow measurement in S Fk Spread Creek, WY (13012475)
Streamflow measurement in S Fk Spread Creek, WY (13012475)
Streamflow measurement in S Fk Spread Creek, WY (13012475)Streamflow measurement in S Fk Spread Creek, WY (13012475)

Walruses resting on an ice floe
A group of Pacific walruses during summer in the Chukchi Sea
A group of Pacific walruses during summer in the Chukchi Sea

Cantilever Staff Plate at Muddy Creek
Cantilever staff plate at Muddy Creek near Hampton streamgage
Cantilever staff plate at Muddy Creek near Hampton streamgage

How Remote Sensing Was Used To Detect Soil Erosion
How Remote Sensing Was Used To Detect Soil ErosionInformation from satellite imagery helped to differentiate areas vulnerable to soil erosion from off-highway vehicle use. For this study we developed a “P-factor” by scaling ground measurements of soil compaction to vehicle disturbances mapped from aerial imagery.
How Remote Sensing Was Used To Detect Soil Erosion
How Remote Sensing Was Used To Detect Soil ErosionInformation from satellite imagery helped to differentiate areas vulnerable to soil erosion from off-highway vehicle use. For this study we developed a “P-factor” by scaling ground measurements of soil compaction to vehicle disturbances mapped from aerial imagery.

Invasives Increases After Wind Turbine Construction
Invasives Increases After Wind Turbine ConstructionInvasives index values before and after turbine construction compared to surrounding control areas (top). Green indicates turbines with higher index values in the period after construction, and yellow indicates no change or lower invasive index values after construction.
Invasives Increases After Wind Turbine Construction
Invasives Increases After Wind Turbine ConstructionInvasives index values before and after turbine construction compared to surrounding control areas (top). Green indicates turbines with higher index values in the period after construction, and yellow indicates no change or lower invasive index values after construction.

USGS employee collects data for Lake Tahoe Nutrient Source project
USGS employee collects data for Lake Tahoe Nutrient Source project

Wind Turbine Sampling Approach
Sampling approach for remote measurements of invasives around wind turbines.
Sampling approach for remote measurements of invasives around wind turbines.

Eyes on Earth Episode 26 – Satellite Constellations
Eyes on Earth Episode 26 – Satellite ConstellationsBetween them, Landsats 7 and 8 image the entire land surface of Earth every eight days. The USGS orbiters are just two of many Earth observing satellites flying at the same altitude and collecting data at the same time of day.
Eyes on Earth Episode 26 – Satellite Constellations
Eyes on Earth Episode 26 – Satellite ConstellationsBetween them, Landsats 7 and 8 image the entire land surface of Earth every eight days. The USGS orbiters are just two of many Earth observing satellites flying at the same altitude and collecting data at the same time of day.

Melanie Madden displays a gophersnake
Researcher Melanie Madden holds up a gophersnake (Pituophis catenifer).
Researcher Melanie Madden holds up a gophersnake (Pituophis catenifer).

Melanie Madden displays Blainville's Horned Lizard
Melanie Madden displays Blainville's Horned LizardResearcher Melanie Madden holds up a Blainville's Horned Lizard (Phrynosoma blainvillii).
Melanie Madden displays Blainville's Horned Lizard
Melanie Madden displays Blainville's Horned LizardResearcher Melanie Madden holds up a Blainville's Horned Lizard (Phrynosoma blainvillii).

Taking habitat photos for Arroyo Toad surveys
James Molden takes habitat photos for Arroyo Toad surveys in Santa Ysabel Creek.
James Molden takes habitat photos for Arroyo Toad surveys in Santa Ysabel Creek.

The Colorado River near Grand Junction, Colorado.
The Colorado River near Grand Junction, Colorado. The entire Colorado River Basin provides water for more than 40 million people in seven states and nearly 5.5 million acres of farmland across the western U.S. and Mexico.
The Colorado River near Grand Junction, Colorado. The entire Colorado River Basin provides water for more than 40 million people in seven states and nearly 5.5 million acres of farmland across the western U.S. and Mexico.

USGS employee making a high flow measurement during a snow melt event
USGS employee making a high flow measurement during a snow melt eventCody Lanpher making a high flow measurement during a snow melt event on the Gallatin River near Gallatin Gateway, MT.
USGS employee making a high flow measurement during a snow melt event
USGS employee making a high flow measurement during a snow melt eventCody Lanpher making a high flow measurement during a snow melt event on the Gallatin River near Gallatin Gateway, MT.
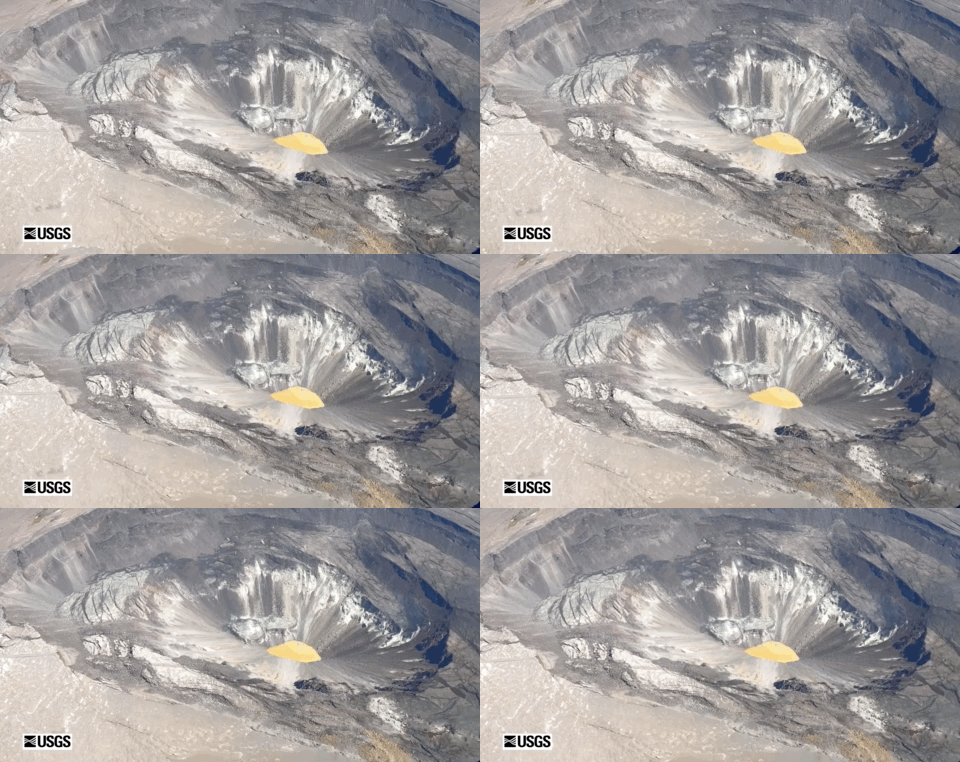
Video of Kīlauea summit from May 29 overflight
This wide-angle video was captured during a helicopter overflight on May 29, and skirts the southern border of Halema‘uma‘u crater. The water lake, filling the bottom of the crater, was tan and brown today, and showed no significant changes. USGS video by M. Patrick.
This wide-angle video was captured during a helicopter overflight on May 29, and skirts the southern border of Halema‘uma‘u crater. The water lake, filling the bottom of the crater, was tan and brown today, and showed no significant changes. USGS video by M. Patrick.
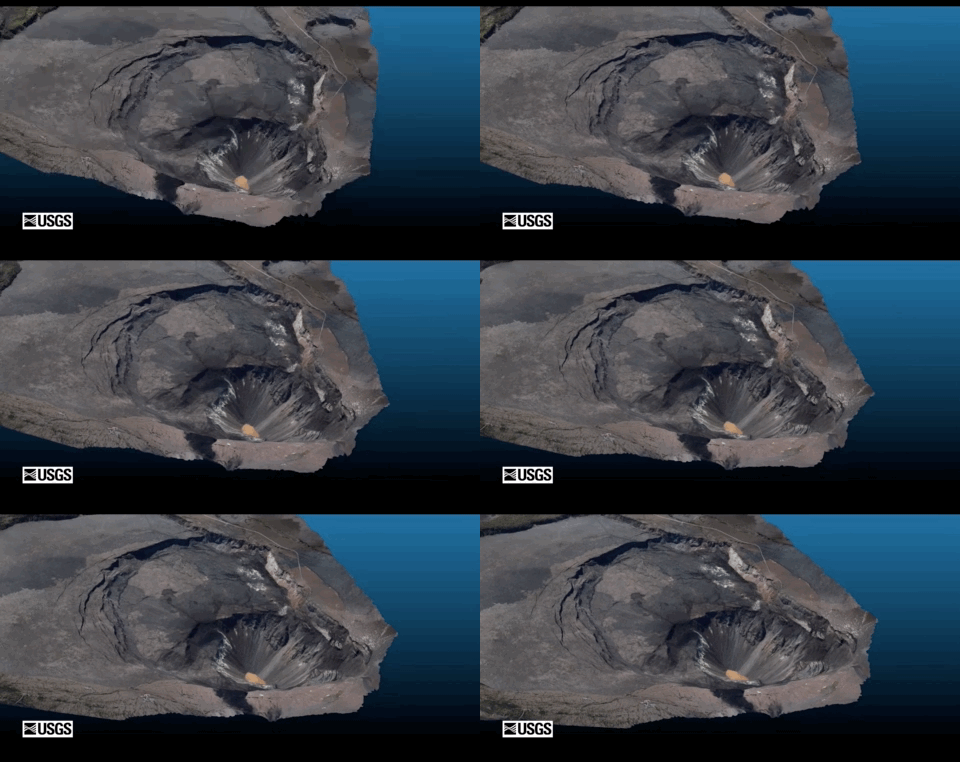
Virtual flyover of Kīlauea summit
A helicopter overflight provided aerial photographs of Kīlauea caldera on May 29, and these photos were used to construct a 3D model. The water lake is visible as the tan area in the deepest portion of Halema‘uma‘u crater. For scale, the water lake is 270 m (885 ft) long and approximately 600 m (1970 ft) below the western caldera rim. USGS photos by K. Mulliken.
A helicopter overflight provided aerial photographs of Kīlauea caldera on May 29, and these photos were used to construct a 3D model. The water lake is visible as the tan area in the deepest portion of Halema‘uma‘u crater. For scale, the water lake is 270 m (885 ft) long and approximately 600 m (1970 ft) below the western caldera rim. USGS photos by K. Mulliken.

Yellowstone Volcano Observatory Monthly Update: June 1, 2020
Yellowstone Volcano Observatory Monthly Update: June 1, 2020Mike Poland, Scientist-in-Charge of the Yellowstone Volcano Observatory, gives an overview of activity at Yellowstone during May 2020.
Yellowstone Volcano Observatory Monthly Update: June 1, 2020
Yellowstone Volcano Observatory Monthly Update: June 1, 2020Mike Poland, Scientist-in-Charge of the Yellowstone Volcano Observatory, gives an overview of activity at Yellowstone during May 2020.

A GPS station that monitors ground deformation on Kīlauea Volcano
A GPS station that monitors ground deformation on Kīlauea VolcanoA GPS station that monitors ground deformation on Kīlauea Volcano, one of the approximately 240 volcano-monitoring stations that Steven Fuke, as part of the HVO Technician Group, designs, installs, and maintains.
A GPS station that monitors ground deformation on Kīlauea Volcano
A GPS station that monitors ground deformation on Kīlauea VolcanoA GPS station that monitors ground deformation on Kīlauea Volcano, one of the approximately 240 volcano-monitoring stations that Steven Fuke, as part of the HVO Technician Group, designs, installs, and maintains.

How an area changes through time with a well pad
Graph showing A) Landsat time series of the Soil-Adjusted Total Vegetation Index (SATVI) from 1984-2011.
Graph showing A) Landsat time series of the Soil-Adjusted Total Vegetation Index (SATVI) from 1984-2011.