Landslide near Potter Hill, Anchorage, Alaska, after 2018 Anchorage earthquake.
Images
Advanced Search
Filters
Advanced Search
Filters
Settings
Explore our planet through photography and imagery, including climate change and water all the way back to the 1800s when the USGS was surveying the country by horse and buggy.
Landslide near Potter Hill, Anchorage, Alaska, after 2018 Anchorage earthquake.
This preliminary thickness map of Kīlauea Volcano's 2018 lower East Rift Zone lava flows was calculated by subtracting pre-eruption ground surface elevations from post-eruption ground surface elevations mapped with USGS Unmanned Aerial System (drone) flights.
This preliminary thickness map of Kīlauea Volcano's 2018 lower East Rift Zone lava flows was calculated by subtracting pre-eruption ground surface elevations from post-eruption ground surface elevations mapped with USGS Unmanned Aerial System (drone) flights.
An animation of the growth of a solar farm, created using Land Change Monitoring, Assessment, and Projection data.
An animation of the growth of a solar farm, created using Land Change Monitoring, Assessment, and Projection data.

High-resolution, bare-earth, airborne light detection and ranging (LiDAR) image, looking obliquely northwest into Rocky Ridge.
High-resolution, bare-earth, airborne light detection and ranging (LiDAR) image, looking obliquely northwest into Rocky Ridge.
By processing lidar point clouds (left) to bare earth DEMs (right), the vegetation is stripped away to reveal past landslides and steep slopes at risk of failure masked by forested canopies. In dense forests, landslides--especially old landslides--might be invisible on aerial images and hard to detect from the ground.
By processing lidar point clouds (left) to bare earth DEMs (right), the vegetation is stripped away to reveal past landslides and steep slopes at risk of failure masked by forested canopies. In dense forests, landslides--especially old landslides--might be invisible on aerial images and hard to detect from the ground.
Livestock water withdrawals in 2015
Livestock water withdrawals in 2015

The alfalfa leafcutting bee (Megachile rotundata) is an introduced species common to Southwest Idaho. They originate from the old world, most likely from northeastern Africa or the Middle East. These bees are successful pollinators of various crops and have been imported to North America for use in agriculture and beekeeping.
The alfalfa leafcutting bee (Megachile rotundata) is an introduced species common to Southwest Idaho. They originate from the old world, most likely from northeastern Africa or the Middle East. These bees are successful pollinators of various crops and have been imported to North America for use in agriculture and beekeeping.
Mangroves on the outside of a playa within Florida Bay.
Mangroves on the outside of a playa within Florida Bay.
Mangroves on the outside of a playa within Florida Bay.
Mangroves on the outside of a playa within Florida Bay.
Mangroves grow along the outside of a playa, one of may in the Florida Bay area.
Mangroves grow along the outside of a playa, one of may in the Florida Bay area.
Study site map for the Massachusetts Shoreline Change Project, 2018 Update: A GIS Compilation of Shoreline Change Rates Calculated Using Digital Shoreline Analysis System Version 5.0, With Supplementary Intersects and Baselines for Massachusetts
Study site map for the Massachusetts Shoreline Change Project, 2018 Update: A GIS Compilation of Shoreline Change Rates Calculated Using Digital Shoreline Analysis System Version 5.0, With Supplementary Intersects and Baselines for Massachusetts

Map of selected earthquakes beneath a portion of southeast Hawai`i from May 4, 2018 to March 14, 2019, showing principally aftershocks following May 4, 2018 M6.9 earthquake. Black dots indicate epicenters of 13,083 earthquakes located during this time interval; yellow stars show locations of the M6.9 earthquake and the March 13, 2019 M5.5 earthquake.
Map of selected earthquakes beneath a portion of southeast Hawai`i from May 4, 2018 to March 14, 2019, showing principally aftershocks following May 4, 2018 M6.9 earthquake. Black dots indicate epicenters of 13,083 earthquakes located during this time interval; yellow stars show locations of the M6.9 earthquake and the March 13, 2019 M5.5 earthquake.

Map of the Martha’s Vineyard and Nantucket study sites outlined in red.
Map of the Martha’s Vineyard and Nantucket study sites outlined in red.

Map showing the locations of all U.S. volcanoes with their threat category designated by color. Very high threat is red, high is orange, moderate is yellow, low is green, and very low is blue.
Map showing the locations of all U.S. volcanoes with their threat category designated by color. Very high threat is red, high is orange, moderate is yellow, low is green, and very low is blue.
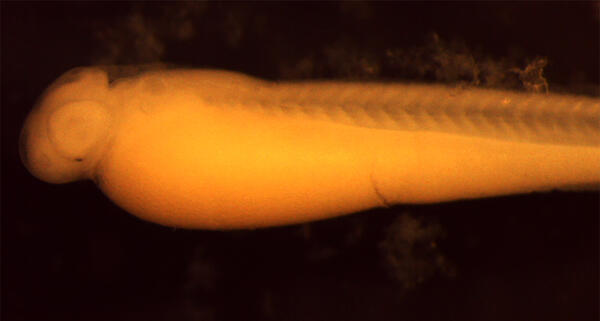
A Grass Carp larva captured during a survey in the Maumee River, a Lake Erie tributary. Grass Carp are an invasive species that consume vegetation destroying habitat used by other species.
A Grass Carp larva captured during a survey in the Maumee River, a Lake Erie tributary. Grass Carp are an invasive species that consume vegetation destroying habitat used by other species.
An aerial view of the prominent 1940 cinder-and-spatter cone on the floor of Mauna Loa's summit caldera. The cone, about 100 m (330 ft) high, was built during a 134-day-long eruption that began on April 7, 1940. Most of the caldera floor around the cone is covered by lava flows erupted in 1984.
An aerial view of the prominent 1940 cinder-and-spatter cone on the floor of Mauna Loa's summit caldera. The cone, about 100 m (330 ft) high, was built during a 134-day-long eruption that began on April 7, 1940. Most of the caldera floor around the cone is covered by lava flows erupted in 1984.
Staudinger dissecting a dolphinfish at the Annual Ducks Fishing tournament in Morehead City, North Carolina. Credit: Joshua Snyder
Staudinger dissecting a dolphinfish at the Annual Ducks Fishing tournament in Morehead City, North Carolina. Credit: Joshua Snyder
Miller collecting geospatial data as part of his dissertation research on drought resources in East Africa.
Miller collecting geospatial data as part of his dissertation research on drought resources in East Africa.

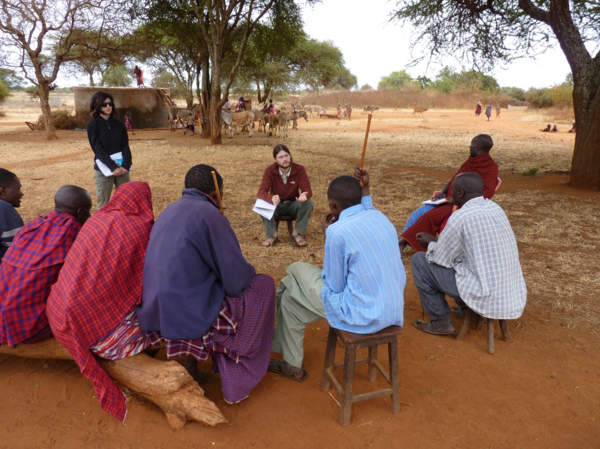
Miller interviewing Maasai pastoralists about how they have coped with drought amidst conservation and land use changes.
Miller interviewing Maasai pastoralists about how they have coped with drought amidst conservation and land use changes.

Mineral-laden water emerging from a hydrothermal vent on the Niua underwater volcano in the Lau Basin, southwest Pacific Ocean. As the water cools, minerals precipitate to form tower-like “chimneys.” Image taken during 2016 cruise “Virtual Vents.”
Mineral-laden water emerging from a hydrothermal vent on the Niua underwater volcano in the Lau Basin, southwest Pacific Ocean. As the water cools, minerals precipitate to form tower-like “chimneys.” Image taken during 2016 cruise “Virtual Vents.”
Mining water withdrawals in 2015
Mining water withdrawals in 2015


