
Lava entering the ocean as seen through steam and rain early this morning.
Images
Explore our planet through photography and imagery, including climate change and water all the way back to the 1800s when the USGS was surveying the country by horse and buggy.
Filter Total Items: 21343

Kīlauea Volcano — Lava Entering Ocean
Lava entering the ocean as seen through steam and rain early this morning.

Kīlauea Volcano — Lower Section of Fissure 8 Flow
The lower section of the fissure 8 lava channel appears to be almost completely crusted over, and the lava level in the channel was lower during this morning's overflight.
The lower section of the fissure 8 lava channel appears to be almost completely crusted over, and the lava level in the channel was lower during this morning's overflight.


Kīlauea Volcano — Small Ash Plume at Halema`uma`u Crater
Kīlauea Volcano — Small Ash Plume at Halema`uma`u Crater
Kīlauea Volcano — Warm Ponds Ocean Entry
Southern end of the active fissure 8 flow margin north of the Analannui Park, known as the warm ponds. The flow margin is estimated to be about 500 m (0.3 mi) from the park.
Southern end of the active fissure 8 flow margin north of the Analannui Park, known as the warm ponds. The flow margin is estimated to be about 500 m (0.3 mi) from the park.

Estero de San Antonio
Aerial view of Estero de San Antonio on Bodega Bay, near Dillon Beach, California.
Aerial view of Estero de San Antonio on Bodega Bay, near Dillon Beach, California.
Kīlauea Volcano — Animated GIF of Crater Subsidence
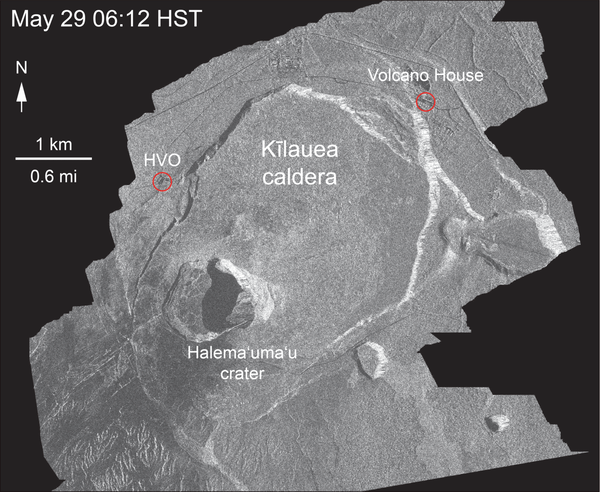
Kīlauea Volcano — Animated GIF of Crater SubsidenceThis animated GIF shows a sequence of radar amplitude images that were acquired by the Agenzia Spaziale Italiana CosmoSkyMed satellite system. The images illustrate changes to the caldera area of Kīlauea Volcano that occurred between May 5 and July 8 at about 6:00 a.m. HST.
Kīlauea Volcano — Animated GIF of Crater Subsidence
Kīlauea Volcano — Animated GIF of Crater SubsidenceThis animated GIF shows a sequence of radar amplitude images that were acquired by the Agenzia Spaziale Italiana CosmoSkyMed satellite system. The images illustrate changes to the caldera area of Kīlauea Volcano that occurred between May 5 and July 8 at about 6:00 a.m. HST.

Kīlauea Volcano — Braided Lava Channel
Braided section of the lava channel located "downstream" between about 3.5 to 6 km (2.2 to 3.7 mi) from fissure 8 (upper right). The width of the two channels in the middle center is about 325 m (1,065 ft). View is toward the southwest.
Braided section of the lava channel located "downstream" between about 3.5 to 6 km (2.2 to 3.7 mi) from fissure 8 (upper right). The width of the two channels in the middle center is about 325 m (1,065 ft). View is toward the southwest.

Kīlauea Volcano — Fissure 8 Overflight
Fissure 8 (lower right) and open lava channel leading to the northeast.
Fissure 8 (lower right) and open lava channel leading to the northeast.

Kīlauea Volcano — Kapoho Crater
View of the partially filled Kapoho Crater (center) and the open lava channel where it makes a 90-degree turn around the crater. The open channel no longer directly enters the ocean. Lava flows freely through the channel only to the southern edge of Kapoho Crater (left side of image).
View of the partially filled Kapoho Crater (center) and the open lava channel where it makes a 90-degree turn around the crater. The open channel no longer directly enters the ocean. Lava flows freely through the channel only to the southern edge of Kapoho Crater (left side of image).

Kīlauea Volcano — Lava Near Cape Kumukahi
Lava still oozes from the northern edge of the ‘a‘ā flow near the lighthouse at Cape Kumukahi (upper right). Smoke from burning vegetation marks location of lava oozeouts. View is toward the northeast.
Lava still oozes from the northern edge of the ‘a‘ā flow near the lighthouse at Cape Kumukahi (upper right). Smoke from burning vegetation marks location of lava oozeouts. View is toward the northeast.

Kīlauea Volcano — Multiple Laze Plumes
Multiple ocean entries were active this early morning, each contributing to the prominent "laze" plume above the area. Lava moves from the open channel through the molten core of the broad ‘a‘ā flow field to the ocean. Kapoho Crater is at middle right of photo.
Multiple ocean entries were active this early morning, each contributing to the prominent "laze" plume above the area. Lava moves from the open channel through the molten core of the broad ‘a‘ā flow field to the ocean. Kapoho Crater is at middle right of photo.

Kīlauea Volcano — Open-Ended Lava Channel
Close view of the "end" of the open lava channel where lava moves beneath the crusted ‘a‘ā flow.
Close view of the "end" of the open lava channel where lava moves beneath the crusted ‘a‘ā flow.

Video camera installation, Barter Island
USGS oceanographer Shawn Harrison poses in front of the USGS video camera installation atop the coastal bluff of Barter Island in northern Alaska.
USGS oceanographer Shawn Harrison poses in front of the USGS video camera installation atop the coastal bluff of Barter Island in northern Alaska.

Camera set-up on Barter Island coastal bluffs
For a short study period, two video cameras overlooked the coast from atop the coastal bluff of Barter Island in northern Alaska. The purpose was to observe and quantify coastal processes such as wave run-up, development of rip channels, bluff erosion, and movement of sandbars and ice floes.
For a short study period, two video cameras overlooked the coast from atop the coastal bluff of Barter Island in northern Alaska. The purpose was to observe and quantify coastal processes such as wave run-up, development of rip channels, bluff erosion, and movement of sandbars and ice floes.

Kīlauea Volcano — Fissure 8
View of Fissure 8 and channel during the morning overflight on July 7.
View of Fissure 8 and channel during the morning overflight on July 7.

Kīlauea Volcano — SO2 Camera
For several years, a special ultraviolet camera has been located near Keanakākoʻi Crater at Kīlauea's summit. The camera was capable of detecting SO2 gas coming from Halema‘uma‘u crater. This morning, the camera was removed because there is very little SO2 to measure these days at the summit.
For several years, a special ultraviolet camera has been located near Keanakākoʻi Crater at Kīlauea's summit. The camera was capable of detecting SO2 gas coming from Halema‘uma‘u crater. This morning, the camera was removed because there is very little SO2 to measure these days at the summit.

USGS ecologists map monitor vegetation and landscape characteristics
USGS ecologists map monitor vegetation and landscape characteristicsUSGS ecologists map and monitor vegetation and landscape characteristics at long-term ecological monitoring sites on the Yukon-Kuskokwim Delta, AK
USGS ecologists map monitor vegetation and landscape characteristics
USGS ecologists map monitor vegetation and landscape characteristicsUSGS ecologists map and monitor vegetation and landscape characteristics at long-term ecological monitoring sites on the Yukon-Kuskokwim Delta, AK

USGS hosts community outreach event on Barter Island
USGS hosts community outreach event on Barter IslandUSGS oceanographer Li Erikson speaks at a community outreach event on Barter Island, Alaska, to present results from earlier USGS studies and to discuss ongoing USGS research.
USGS hosts community outreach event on Barter Island
USGS hosts community outreach event on Barter IslandUSGS oceanographer Li Erikson speaks at a community outreach event on Barter Island, Alaska, to present results from earlier USGS studies and to discuss ongoing USGS research.

Female Pribilof rock sandpiper, St. Matthew Island, Bering Sea
Female Pribilof rock sandpiper, St. Matthew Island, Bering SeaIn 2018, biologists conducted a second population survey to reassess the population status and habitat associations of Pribilof rock sandpipers breeding on St. Matthew and Hall Islands in the Bering Sea, Alaska. Previous work estimated the population size at approximately 19,800 birds (Ruthrauff et al. 2012).

Kīlauea Volcano — Kapoho Bay
Ocean entry in Kapoho as viewed from morning helicopter overflight.
Ocean entry in Kapoho as viewed from morning helicopter overflight.