Florida Coral Reefs and Coastal Hazard Risk Reduction
Florida Coral Reefs and Coastal Hazard Risk ReductionRigorously Valuing the Role of Florida’s Coral Reefs in Coastal Hazard Risk Reduction
Estimated Annual Benefits

Official websites use .gov
A .gov website belongs to an official government organization in the United States.
Secure .gov websites use HTTPS
A lock () or https:// means you’ve safely connected to the .gov website. Share sensitive information only on official, secure websites.
Coastal and Marine Hazards and Resources Program images.

Rigorously Valuing the Role of Florida’s Coral Reefs in Coastal Hazard Risk Reduction
Estimated Annual Benefits
Rigorously Valuing the Role of Florida’s Coral Reefs in Coastal Hazard Risk Reduction
Estimated Annual Benefits

Rigorously Valuing the Role of Hawaiʻi’s Coral Reefs in Coastal Hazard Risk Reduction
Estimated Annual Benefits
Rigorously Valuing the Role of Hawaiʻi’s Coral Reefs in Coastal Hazard Risk Reduction
Estimated Annual Benefits

Rigorously Valuing the Role of Puerto Rico’s Coral Reefs in Coastal Hazard Risk Reduction
Estimated Annual Benefits
Rigorously Valuing the Role of Puerto Rico’s Coral Reefs in Coastal Hazard Risk Reduction
Estimated Annual Benefits

Rigorously Valuing the Role of the U.S. Virgin Islands’ Coral Reefs in Coastal Hazard Risk Reduction
Estimated Annual Benefits
Rigorously Valuing the Role of the U.S. Virgin Islands’ Coral Reefs in Coastal Hazard Risk Reduction
Estimated Annual Benefits

Digital three-dimensional rendering of the coastal cliffs around Point Dume in Malibu, California. Cliff feature outputs from the Cliff Feature Delineation Tool are shown to conceptually display the cliff delineation process, including cross-shore transects (green), the cliff top line (red), the cliff toe line (blue), and subsidiary cliff features (orange).
Digital three-dimensional rendering of the coastal cliffs around Point Dume in Malibu, California. Cliff feature outputs from the Cliff Feature Delineation Tool are shown to conceptually display the cliff delineation process, including cross-shore transects (green), the cliff top line (red), the cliff toe line (blue), and subsidiary cliff features (orange).

Evolution of the shoreline around the Elwha River mouth, Washington, before, during and after dam removal, 2011–2017. Two large dams were removed from the Elwha River between 2011 and 2014 in the largest dam removal worldwide thus far, releasing more than 20 million tons of sediment downstream.
Evolution of the shoreline around the Elwha River mouth, Washington, before, during and after dam removal, 2011–2017. Two large dams were removed from the Elwha River between 2011 and 2014 in the largest dam removal worldwide thus far, releasing more than 20 million tons of sediment downstream.

A coral reef in the Turks and Caicos Islands dominated by the weedy coral species, Porites astreoides. The relative dominance of this taxa has increased throughout the western Atlantic.
A coral reef in the Turks and Caicos Islands dominated by the weedy coral species, Porites astreoides. The relative dominance of this taxa has increased throughout the western Atlantic.

ROV SuBastian’s manipulator jaw stabilizes GEOMAR’s glowing bubble box that is capturing high-resolution images of methane bubbles rising from the seafloor.
ROV SuBastian’s manipulator jaw stabilizes GEOMAR’s glowing bubble box that is capturing high-resolution images of methane bubbles rising from the seafloor.

USGS scientists Dan Powers (left) and Andy Ritchie retrieving a core sample from beneath Lake Ozette aboard research vessel Hadai.
USGS scientists Dan Powers (left) and Andy Ritchie retrieving a core sample from beneath Lake Ozette aboard research vessel Hadai.
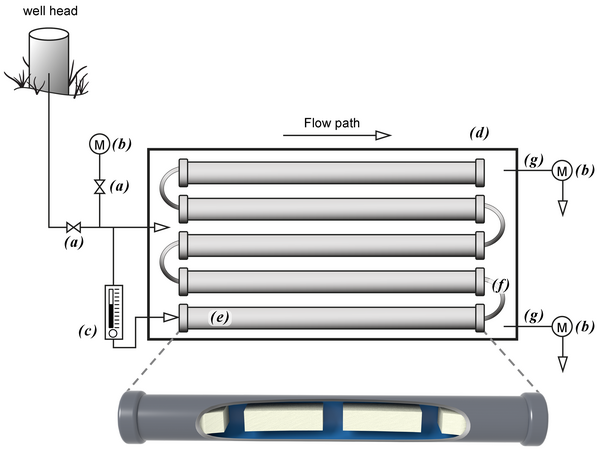
Above ground mesocosm with biofilm growth reactors. Groundwater from the well head is directly transferred to the mesocosm via PTFE tubing into a high flow rate control valve (a) that diverts groundwater into a flow cell containing a water quality measurement meter (b) and a low flow control valve (c).
Above ground mesocosm with biofilm growth reactors. Groundwater from the well head is directly transferred to the mesocosm via PTFE tubing into a high flow rate control valve (a) that diverts groundwater into a flow cell containing a water quality measurement meter (b) and a low flow control valve (c).

Photographs showing equipment used during bathymetric and topographic surveys along the Columbia River littoral cell, Washington and Oregon.
Photographs showing equipment used during bathymetric and topographic surveys along the Columbia River littoral cell, Washington and Oregon.

Woods Hole Coastal and Marine Science Center geologist, Ben Gutierrez, moderates a panel at the 2019 Partnership Eucation Program (PEP) 10th Anniversity Conference and Celebration, Woods Hole, MA June 28-30, 2019.
Woods Hole Coastal and Marine Science Center geologist, Ben Gutierrez, moderates a panel at the 2019 Partnership Eucation Program (PEP) 10th Anniversity Conference and Celebration, Woods Hole, MA June 28-30, 2019.


Image map of study area showing (a) study region, (b) study sites, (c, d) example orthomosaic images, and (e) photo of SET 1.
Image map of study area showing (a) study region, (b) study sites, (c, d) example orthomosaic images, and (e) photo of SET 1.

Head of the Meadow Beach, Cape Cod National Seashore, Massachusetts
Head of the Meadow Beach, Cape Cod National Seashore, Massachusetts

Head of the Meadow Beach, Cape Cod National Seashore, Massachusetts
Head of the Meadow Beach, Cape Cod National Seashore, Massachusetts

Coastal and Marine scientists collect data in the field.
Coastal and Marine scientists collect data in the field.

Multibeam bathymetry shown in the spectrum from red (shallower) to blue (deeper) for depths greater than 200 m across the head of Astoria Canyon. The land and continental shelf are shown in grayscale slope shading where darker colors represent steeper slopes. The modern Columbia River is far right.
Multibeam bathymetry shown in the spectrum from red (shallower) to blue (deeper) for depths greater than 200 m across the head of Astoria Canyon. The land and continental shelf are shown in grayscale slope shading where darker colors represent steeper slopes. The modern Columbia River is far right.

Topography and bathymetry of southern Cascadia, which includes southern Oregon and northern California (seafloor depths between 200 and 3000 m are shown in the spectrum color scale from red (shallower) to purple (deeper). The land and continental shelf are shown in grayscale slope shading where darker colors represent steeper slopes.
Topography and bathymetry of southern Cascadia, which includes southern Oregon and northern California (seafloor depths between 200 and 3000 m are shown in the spectrum color scale from red (shallower) to purple (deeper). The land and continental shelf are shown in grayscale slope shading where darker colors represent steeper slopes.

High ice content permafrost bluff erosion at Barter Island in 2019 after several coastal storms and a prolonged time of anomalously high air temperatures.
High ice content permafrost bluff erosion at Barter Island in 2019 after several coastal storms and a prolonged time of anomalously high air temperatures.

Once removed from the pressure core testing tool, this specimen shows that it is not a homogeneous sediment. The mostly fine-grained sample (dark sediment in all three images) easily breaks apart at a thin layer of coarse-grained sediment (light sediment on the inner core surfaces of images (i) and (ii).
Once removed from the pressure core testing tool, this specimen shows that it is not a homogeneous sediment. The mostly fine-grained sample (dark sediment in all three images) easily breaks apart at a thin layer of coarse-grained sediment (light sediment on the inner core surfaces of images (i) and (ii).