
Brain coral spawning coral larvae. The larvae will settle on other surfaces and grow into new coral in a process called recruitment.
Images
Coastal and Marine Hazards and Resources Program images.
Filter Total Items: 2413

Brain coral spawning coral larvae
Brain coral spawning coral larvae. The larvae will settle on other surfaces and grow into new coral in a process called recruitment.

Aerial Imagery of Black Beach, Falmouth, MA
Products of Structure-from-Motion applied to data collected by UAS in Black Beach, Falmouth, MA
Products of Structure-from-Motion applied to data collected by UAS in Black Beach, Falmouth, MA

Study site for Edwin B. Forsythe National Wildlife Refuge, New Jersey
Study site for Edwin B. Forsythe National Wildlife Refuge, New JerseyEdwin B. Forsythe National Wildlife Refuge, New Jersey Study SIte
Study site for Edwin B. Forsythe National Wildlife Refuge, New Jersey
Study site for Edwin B. Forsythe National Wildlife Refuge, New JerseyEdwin B. Forsythe National Wildlife Refuge, New Jersey Study SIte

Surficial Geology of Vineyard and western Nantucket Sounds
Surficial Geology of Vineyard and western Nantucket SoundsMap showing the surficial geology of Vineyard and western Nantucket Sounds with equivalent onshore geology (adapted from Stone and DiGiacomo-Cohen, 2009). The areal extents over which offshore subsurface geologic units crop out at the sea floor were interpreted from seismic-reflection data.

Testing the Water!
Jen Suttles,Woods Hole Coastal and Marine Science Center, collects water samples from a salt marsh tidal creek (East Falmouth, MA) for laboratory analysis of total organic carbon. These samples will be compared to data recorded by instrumentation deployed in an adjacent tidal creek as part of research efforts to quantify carbon dynamics in coastal ecosystems
Jen Suttles,Woods Hole Coastal and Marine Science Center, collects water samples from a salt marsh tidal creek (East Falmouth, MA) for laboratory analysis of total organic carbon. These samples will be compared to data recorded by instrumentation deployed in an adjacent tidal creek as part of research efforts to quantify carbon dynamics in coastal ecosystems

Map of seabed geology and sun-illuminated topography, Stellwagen Bank
Map of seabed geology and sun-illuminated topography, Stellwagen BankMap of seabed geology and sun-illuminated topography, Stellwagen Bank Blue and purple = boulder ridges. Redlines = leading edges of sand sheets
Map of seabed geology and sun-illuminated topography, Stellwagen Bank
Map of seabed geology and sun-illuminated topography, Stellwagen BankMap of seabed geology and sun-illuminated topography, Stellwagen Bank Blue and purple = boulder ridges. Redlines = leading edges of sand sheets

Sand ridge morphology and bedform migration patterns
Sand ridge morphology and bedform migration patternsSand ridge morphology and bedform migration patterns offshore of Assateague Island
Sand ridge morphology and bedform migration patterns
Sand ridge morphology and bedform migration patternsSand ridge morphology and bedform migration patterns offshore of Assateague Island

Area of southern California covered by CoSMoS forecasts
Area of southern California covered by CoSMoS forecastsCurrent CoSMoS coastal hazard forecasts cover southern California, from Santa Barbara County in the north to San Diego County in the south.
Area of southern California covered by CoSMoS forecasts
Area of southern California covered by CoSMoS forecastsCurrent CoSMoS coastal hazard forecasts cover southern California, from Santa Barbara County in the north to San Diego County in the south.

USGS scientist records piping plover habitat characteristics
USGS scientist records piping plover habitat characteristicsUSGS scientist Sara Zeigler records habitat characteristics in iPlover at an ‘exclosed’ nest. On some beaches, managers erect netting around nests to protect eggs/chicks and adults from predators, allowing movement of chicks and parents to and from the nest but excluding predators

Location map of the North and South Shores of Long Island, NY
Location map of the North and South Shores of Long Island, NYGroundwater data were collected in the spring and fall of 2008 from three sites representing different geological settings and biogeochemical conditions within the surficial glacial aquifer of Long Island, NY.

Edwin B Forsythe National Wildlife Refuge study area
Edwin B Forsythe National Wildlife Refuge study areaBrowse graphic of Edwin B Forsythe National Wildlife Refuge study area
Edwin B Forsythe National Wildlife Refuge study area
Edwin B Forsythe National Wildlife Refuge study areaBrowse graphic of Edwin B Forsythe National Wildlife Refuge study area

Unmanned Aerial System (UAS) pilot
Sandy Brosnahan performing first solo flight as a USGS certified drone pilot. There are multiple exciting applications for drone imagery including erosion studies and physical changes to coastal ecosystems over time.
Sandy Brosnahan performing first solo flight as a USGS certified drone pilot. There are multiple exciting applications for drone imagery including erosion studies and physical changes to coastal ecosystems over time.

Offshore of Point Estero
Seafloor offshore of Point Estero (PE) showing east (EH) and west (WH) strands of the Hosgri fault zone. Arrow points to a seafloor slope (a 12,000 year old shoreline) that has been offset by the east Hosgri strand, indicating a slip rate of about 2.6 millimeters per year.
Seafloor offshore of Point Estero (PE) showing east (EH) and west (WH) strands of the Hosgri fault zone. Arrow points to a seafloor slope (a 12,000 year old shoreline) that has been offset by the east Hosgri strand, indicating a slip rate of about 2.6 millimeters per year.

Large submarine slides off southern California
Large submarine slides off southern California (outlined in small white dots). Low-resolution bathymetry shown in light grey (approximately 100 meters/pixel). High-resolution bathymetry shown in darker grey (less than 20 meters/pixel).
Large submarine slides off southern California (outlined in small white dots). Low-resolution bathymetry shown in light grey (approximately 100 meters/pixel). High-resolution bathymetry shown in darker grey (less than 20 meters/pixel).

Scientists doing field work at Elwha River
Researchers survey Elwha River elevation and depths. Clockwise from upper left: setting up a traditional survey instrument above the river; measuring river depths from a kayak with sonar and GPS; walking the beach with GPS backpacks; and determining offshore depths using a personal watercraft with GPS and sonar.
Researchers survey Elwha River elevation and depths. Clockwise from upper left: setting up a traditional survey instrument above the river; measuring river depths from a kayak with sonar and GPS; walking the beach with GPS backpacks; and determining offshore depths using a personal watercraft with GPS and sonar.

Schematic showing how sediment on the seafloor moves
Schematic showing how sediment on the seafloor movesSchematic showing how sediment on the seafloor moves in response to a force created by the combined action of tides, ocean waves, and wind-driven currents.
Schematic showing how sediment on the seafloor moves
Schematic showing how sediment on the seafloor movesSchematic showing how sediment on the seafloor moves in response to a force created by the combined action of tides, ocean waves, and wind-driven currents.

Screenshot of Total Water Level and Coastal-Change Forecast Viewer
Screenshot of Total Water Level and Coastal-Change Forecast ViewerScreenshot of Total Water Level and Coastal-Change Forecast Viewer (<https://coastal.er.usgs.gov/hurricanes/research/twlviewer/>) on June 4, 2016, two days before Tropical Storm Colin was expected to hit Florida’s Gulf of America coast.

Video camera atop a hotel in Madeira Beach, Florida.
Video camera atop a hotel in Madeira Beach, Florida.Video-camera station installed by Jenna Brown and Joe Long atop a hotel in Madeira Beach, Florida.
Video camera atop a hotel in Madeira Beach, Florida.
Video camera atop a hotel in Madeira Beach, Florida.Video-camera station installed by Jenna Brown and Joe Long atop a hotel in Madeira Beach, Florida.

Wave runup at Madeira Beach Florida during a storm
Wave runup at Madeira Beach Florida during a stormWave runup at Madeira Beach, Florida, during Tropical Storm Colin
Wave runup at Madeira Beach Florida during a storm
Wave runup at Madeira Beach Florida during a stormWave runup at Madeira Beach, Florida, during Tropical Storm Colin

Coastal and Marine Geology Program team at the USGS awards ceremony
Coastal and Marine Geology Program team at the USGS awards ceremonyCoastal and Marine Geology Program web team members receive their awards at the USGS Awards Ceremony on May 3, 2016. From left to right: USGS Director Suzette Kimball, who presented the awards; Jolene Gittens; Greg Miller; Kerry Rae, Chief of Staff for Jennifer Gimbel, Deputy Assistant Secretary for Water and Science, U.S. Dept.
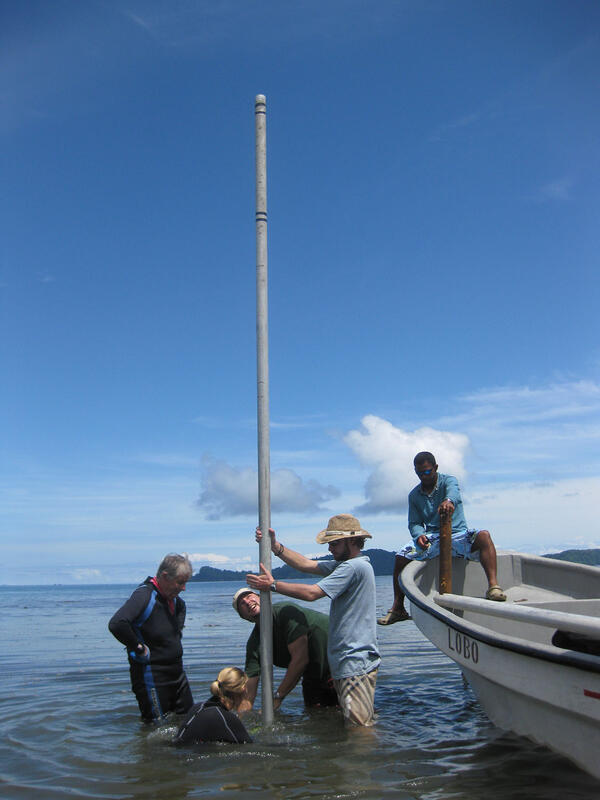
Taking a coral core in the Gulf of Chiriqui, Panama
Taking a coral core in the Gulf of Chiriqui, PanamaCollecting a coral core in the Gulf of Chiriqui, Panama, by forcing a 20-foot aluminum tube into the reef. This core retrieved about 6,000 years of reef history.
Taking a coral core in the Gulf of Chiriqui, Panama
Taking a coral core in the Gulf of Chiriqui, PanamaCollecting a coral core in the Gulf of Chiriqui, Panama, by forcing a 20-foot aluminum tube into the reef. This core retrieved about 6,000 years of reef history.