
(A). Algal bloom magnitude in Florida lakes in 2011 before normalization and (B) after normalization by lake surface area. Area-normalized magnitude (km−2) of selected lakes provided as part of bar labels in parenthesis.
Images
All items in this gallery are considered public domain unless otherwise noted.
Filter Total Items: 518

Algal bloom magnitude in Florida lakes
(A). Algal bloom magnitude in Florida lakes in 2011 before normalization and (B) after normalization by lake surface area. Area-normalized magnitude (km−2) of selected lakes provided as part of bar labels in parenthesis.

Map of the study region showing the location of lakes in FL and OH
Map of the study region showing the location of lakes in FL and OHMap of the study region showing the location of lakes in (A) Florida and (B) Ohio. In total, 135 lakes in Florida and 21 lakes in Ohio, were resolvable with the full resolution MERIS data and are used in this study. Land and lakes are shown in gray and blue colors respectively.

20191009_163528 Mike F.
This picture shows MJF in Reston working with his team on work planning guidance for the scientists funded by the Ecosystems Mission Area, Environmental Health Program
This picture shows MJF in Reston working with his team on work planning guidance for the scientists funded by the Ecosystems Mission Area, Environmental Health Program

Sampling rain induced runoff from wastewater effluent-irrigated agricultural runoff site on August 30, 2019, at the Oklahoma State University South Central Research Station in Chickasha, Oklahoma. Photograph by Jason Masoner, U.S. Geological Survey.
Sampling rain induced runoff from wastewater effluent-irrigated agricultural runoff site on August 30, 2019, at the Oklahoma State University South Central Research Station in Chickasha, Oklahoma. Photograph by Jason Masoner, U.S. Geological Survey.This photo show runoff from an experimental plot through a weir. Scientists carried out the study at the Oklahoma State University South Central Research Station in Chickasha, Oklahoma. Its a good example of rain induced runoff.
Sampling rain induced runoff from wastewater effluent-irrigated agricultural runoff site on August 30, 2019, at the Oklahoma State University South Central Research Station in Chickasha, Oklahoma. Photograph by Jason Masoner, U.S. Geological Survey.
Sampling rain induced runoff from wastewater effluent-irrigated agricultural runoff site on August 30, 2019, at the Oklahoma State University South Central Research Station in Chickasha, Oklahoma. Photograph by Jason Masoner, U.S. Geological Survey.Sampling rain induced runoff from wastewater effluent-irrigated agricultural runoff site on August 30, 2019, at the Oklahoma State University South Central Research Station in Chickasha, Oklahoma. Photograph by Jason Masoner, U.S. Geological Survey.
Sampling rain induced runoff from wastewater effluent-irrigated agricultural runoff site on August 30, 2019, at the Oklahoma State University South Central Research Station in Chickasha, Oklahoma. Photograph by Jason Masoner, U.S. Geological Survey.This photo show runoff from an experimental plot through a weir. Scientists carried out the study at the Oklahoma State University South Central Research Station in Chickasha, Oklahoma. Its a good example of rain induced runoff.

Graphical depiction of three sources of variation in methylmercury
Graphical depiction of three sources of variation in methylmercuryGraphical depiction of three sources of variation that can affect accumulation of methylmercury in black rails: habitat (sediment) biogeochemistry, food web structure and biomagnification, and diet composition. Methylmercury moves from the sediment into the wetland food web and accumulates in rail tissues.

The cyanobacteria Gleotrichia shown under a microscope
The cyanobacteria Gleotrichia shown under a microscopeThe cyanobacteria Gleotrichia shown under a microscope from a water sample collected at Ek Lake Trail, a popular recreational area in Kabetogama Lake where algal blooms frequently occur. Gleotrichia can produce microcystin.

Cyanobacterial bloom at Kabetogama Lake Visitor Center
Cyanobacterial bloom at Kabetogama Lake Visitor CenterAn algal bloom forming in Kabetogama Lake near Kabetogama Visitor Center, Voyageurs National Park
Cyanobacterial bloom at Kabetogama Lake Visitor Center
Cyanobacterial bloom at Kabetogama Lake Visitor CenterAn algal bloom forming in Kabetogama Lake near Kabetogama Visitor Center, Voyageurs National Park

Collecting sediment core freezing drive shoe technology hollow auger
Collecting sediment core freezing drive shoe technology hollow augerCollecting a sediment core with the freezing drive shoe technology on a hollow stem auger drill rig at Bemidji oil spill site.
Collecting sediment core freezing drive shoe technology hollow auger
Collecting sediment core freezing drive shoe technology hollow augerCollecting a sediment core with the freezing drive shoe technology on a hollow stem auger drill rig at Bemidji oil spill site.

Groundwater sampling along the north well transect at the Bemidji site
Groundwater sampling along the north well transect at the Bemidji siteGroundwater sampling along the north well transect at the Bemidji site.
Groundwater sampling along the north well transect at the Bemidji site
Groundwater sampling along the north well transect at the Bemidji siteGroundwater sampling along the north well transect at the Bemidji site.

Bemidji oil spill research team group photo
Group photo of USGS Bemidi oil spill research team meeting in June of 2019 at Ruttgers Birchmont Lodge in Bemidji, MN.
Group photo of USGS Bemidi oil spill research team meeting in June of 2019 at Ruttgers Birchmont Lodge in Bemidji, MN.
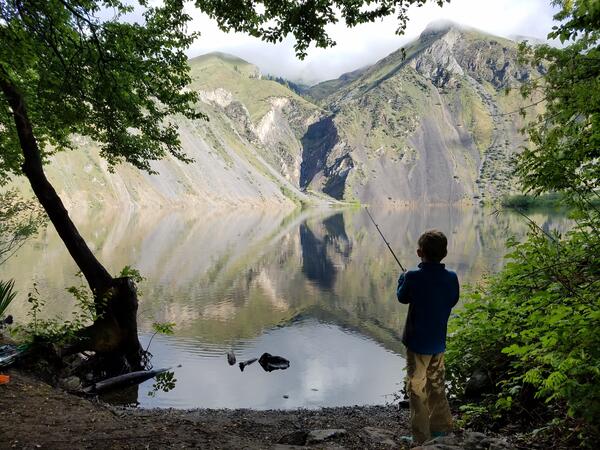
Fishing on Hells Canyon Reservoir, Snake River, Idaho-Oregon.
Fishing on Hells Canyon Reservoir, Snake River, Idaho-Oregon.Fishing on Hells Canyon Reservoir, Snake River, Idaho-Oregon. Photo Credit: Austin Baldwin
Fishing on Hells Canyon Reservoir, Snake River, Idaho-Oregon.
Fishing on Hells Canyon Reservoir, Snake River, Idaho-Oregon.Fishing on Hells Canyon Reservoir, Snake River, Idaho-Oregon. Photo Credit: Austin Baldwin

The Water Cycle for Kids
Learn About Water!

Skin lesion on smallmouth bass from Chesapeake Bay watershed.
Skin lesion on smallmouth bass from Chesapeake Bay watershed.A hyperpigmented melanistic skin lesion on a Smallmouth Bass from the Chesapeake Bay Watershed.
Skin lesion on smallmouth bass from Chesapeake Bay watershed.
Skin lesion on smallmouth bass from Chesapeake Bay watershed.A hyperpigmented melanistic skin lesion on a Smallmouth Bass from the Chesapeake Bay Watershed.

Scientists reviewing instrument performance
Scientists reviewing data to determine instrument performance at the Algal Toxins Laboratory in Lawrence Kansas.
Scientists reviewing data to determine instrument performance at the Algal Toxins Laboratory in Lawrence Kansas.

American kestrel eggs
American kestrel eggs

Captive Japanese quail (Coturnix japonica)
Captive Japanese quail (Coturnix japonica), and wheat seeds with (brown) and without (cream) pesticide coatings used to treat insect pests.
Captive Japanese quail (Coturnix japonica), and wheat seeds with (brown) and without (cream) pesticide coatings used to treat insect pests.

American kestrel
American kestrel (Falco sparverius)
American kestrel (Falco sparverius)

American kestrel
American kestrel (Falco sparverius)
American kestrel (Falco sparverius)

Biplot of principal component analysis
Biplot of principal component analysis of soil elemental composition data. Background and enriched samples are denoted. Colored points are from potentially enriched soils at mine sites, and black points are from unmined background sites. The effect of different elements on the analysis is shown by the rays, which are labeled to identify the elements.
Biplot of principal component analysis of soil elemental composition data. Background and enriched samples are denoted. Colored points are from potentially enriched soils at mine sites, and black points are from unmined background sites. The effect of different elements on the analysis is shown by the rays, which are labeled to identify the elements.
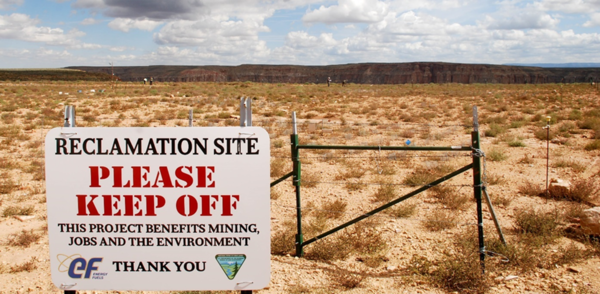
Kanab North reclamation study site informational sign.
Kanab North reclamation study site informational sign.Kanab North reclamation study site informational sign. These signs identify the project benefits in mining, jobs and the environment.
Kanab North reclamation study site informational sign.
Kanab North reclamation study site informational sign.Kanab North reclamation study site informational sign. These signs identify the project benefits in mining, jobs and the environment.
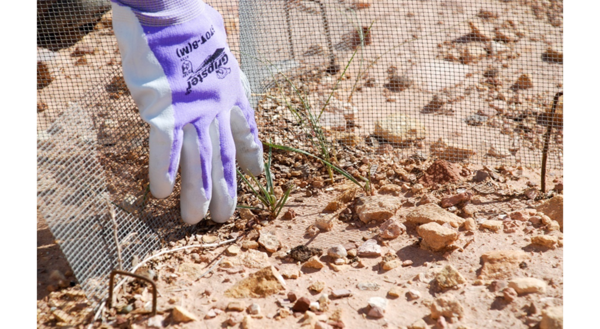
Native seedling establishing in a Connectivity Modifier in a reclamation experiment
Native seedling establishing in a Connectivity Modifier in a reclamation experimentNative seedling establishing in a Connectivity Modifier in a reclamation experiment. Photo: Mike Duniway
Native seedling establishing in a Connectivity Modifier in a reclamation experiment
Native seedling establishing in a Connectivity Modifier in a reclamation experimentNative seedling establishing in a Connectivity Modifier in a reclamation experiment. Photo: Mike Duniway