
Reduced-size map of the Colorado River Basin from the USGS ASIST Initiative, Sept. 3, 2024
Images
Images intro.
Filter Total Items: 187

Colorado_River_Basin_small.jpg
Reduced-size map of the Colorado River Basin from the USGS ASIST Initiative, Sept. 3, 2024

Map of Colorado River Basin
Map of the Colorado River Basin in Wyoming, Colorado, Utah, Nevada, California, Arizona, and New Mexico
Map of the Colorado River Basin in Wyoming, Colorado, Utah, Nevada, California, Arizona, and New Mexico

coloradoriverbasinviausgs_0 (1).png
Large map of the Colorado River Basin prepared for the USGS Colorado River Basin ASIST Initiative
Large map of the Colorado River Basin prepared for the USGS Colorado River Basin ASIST Initiative
Collecting soil stability data
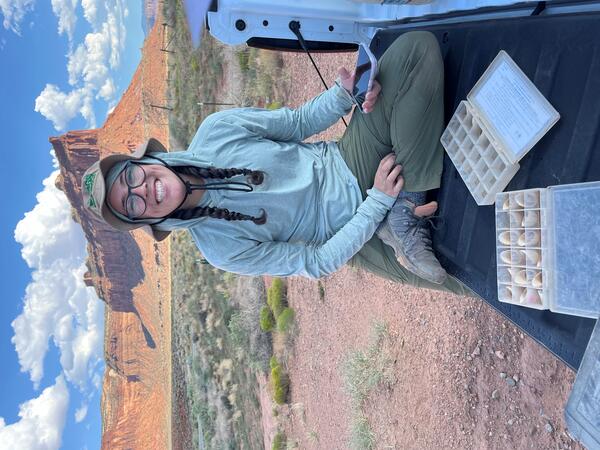
Sarah Costanzo (USGS) collects soil stability data prior to installing RestoreNet version 2.0 treatments at Canyonlands Research Center near Moab, UT. Photo by Laura Shriver (USGS).
Sarah Costanzo (USGS) collects soil stability data prior to installing RestoreNet version 2.0 treatments at Canyonlands Research Center near Moab, UT. Photo by Laura Shriver (USGS).

Celebrating a successful restoration experiment installation
Celebrating a successful restoration experiment installationFrom left to right, Ember Bradbury (Colorado State University), Sarah Costanzo (USGS), Sonoma Brill (USGS), and Laura Shriver (USGS) celebrate installing a RestoreNet site at Canyonlands Research Center near Moab, UT.

Lower Colorado Basin Precipitation Temperature 1896-2019_graph.jpg
Lower Colorado Basin Precipitation Temperature 1896-2019_graph.jpgGraphs showing trends in atmospheric precipitation and air temperature in the Lower Colorado River Basin, 1896-2019
Lower Colorado Basin Precipitation Temperature 1896-2019_graph.jpg
Lower Colorado Basin Precipitation Temperature 1896-2019_graph.jpgGraphs showing trends in atmospheric precipitation and air temperature in the Lower Colorado River Basin, 1896-2019

Copper.production.by_.US_.state_.pie_.chart_.2020.jpg
Copper.production.by_.US_.state_.pie_.chart_.2020.jpgPie chart showing copper production in leading copper producing U.S. states in 2020 by Eric Anderson of the Geology, Geophysics, and Geochemistry Science Center, August 2024
Copper.production.by_.US_.state_.pie_.chart_.2020.jpg
Copper.production.by_.US_.state_.pie_.chart_.2020.jpgPie chart showing copper production in leading copper producing U.S. states in 2020 by Eric Anderson of the Geology, Geophysics, and Geochemistry Science Center, August 2024
Thunderstorm at Indian Creek, San Juan County, Utah
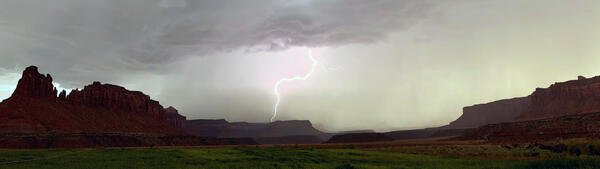
Thunderstorm at Indian Creek, San Juan County, UtahA lightening bolt strikes the plateau during a thunderstorm at Indian Creek, San Juan County, Utah. Photo by Mike Duniway, USGS.
Thunderstorm at Indian Creek, San Juan County, Utah
Thunderstorm at Indian Creek, San Juan County, UtahA lightening bolt strikes the plateau during a thunderstorm at Indian Creek, San Juan County, Utah. Photo by Mike Duniway, USGS.

GSL.Applegate
USGS Director, David Applegate visits Great Salt Lake with Rocky Mt Region Director, Peter Griffiths, UT WSC Director, David O'Leary, UT WSC scientists, and many cooperators.
USGS Director, David Applegate visits Great Salt Lake with Rocky Mt Region Director, Peter Griffiths, UT WSC Director, David O'Leary, UT WSC scientists, and many cooperators.

Sagebrush Collaborative Restoration Landscapes
Sagebrush Collaborative Restoration Landscapes capture over a third of the remaining intact Core Sagebrush Areas across the sagebrush biome.
Layer Sources
Sagebrush Collaborative Restoration Landscapes capture over a third of the remaining intact Core Sagebrush Areas across the sagebrush biome.
Layer Sources

Wyoming and Northeast Utah Sagebrush Collaborative Restoration Landscape
Wyoming and Northeast Utah Sagebrush Collaborative Restoration LandscapeSagebrush Collaborative Restoration Landscapes capture over a third of the remaining intact Core Sagebrush Areas across the sagebrush biome.
Wyoming and Northeast Utah Sagebrush Collaborative Restoration Landscape
Wyoming and Northeast Utah Sagebrush Collaborative Restoration LandscapeSagebrush Collaborative Restoration Landscapes capture over a third of the remaining intact Core Sagebrush Areas across the sagebrush biome.
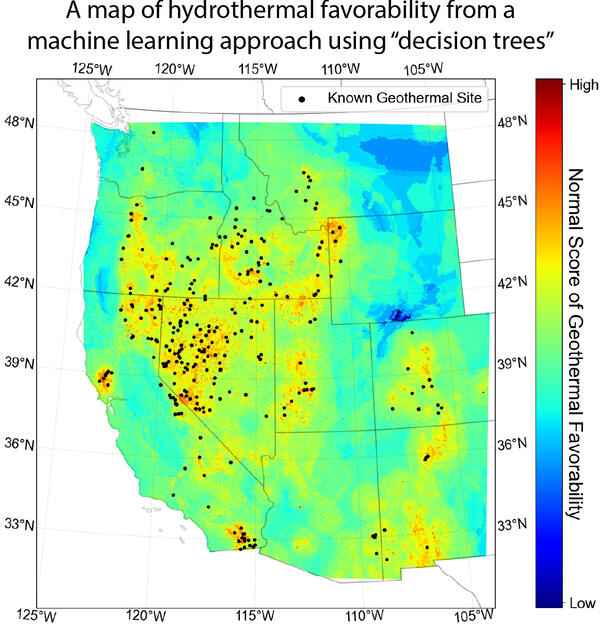
Map of areas predicted as having conditions favorable for fostering a hydrothermal system in the western United States
Map of areas predicted as having conditions favorable for fostering a hydrothermal system in the western United StatesMap of areas predicted as having conditions favorable for fostering a hydrothermal system in the western United States. Black dots are mapped hydrothermal systems. From Mordensky et al., 2023 (https://www.sciencedirect.com/science/article/pii/S0375650523000160).

Upper Colorado River Basin streamflow, March-August 2023
Upper Colorado River Basin streamflow, March-August 2023March-August daily average streamflow for the last 30 years (1991-2022) (dark gray lines) compared to 2023, showing the periods where 2023 streamflow was above (blue) and below (orange) the historical average. Individual years of the relevant historical streamflow period are shown in light gray.

0020-iamSeaWolf-16112022
USGS prepares to connect with water-quality platform to service instrumentation and prepare to remove from lake for winter.
USGS prepares to connect with water-quality platform to service instrumentation and prepare to remove from lake for winter.

0008-iamSeaWolf-16112022
USGS boat approaches water-quality platform. Technicians prepare to pull anchor and remove for lake for winter.
USGS boat approaches water-quality platform. Technicians prepare to pull anchor and remove for lake for winter.

0001-iamSeawolf-16112022
Scientists prepare to remove water-quality platform from the lake for the winter.
Scientists prepare to remove water-quality platform from the lake for the winter.

0010-iamSeawolf-16112022
Photographer, Jake Seawolf, captured an aerial view of Bear Lake, USGS boat, and employees on a water-quality platform on a cold and blustery November day using a drone. Jake volunteered his time and talents with the USGS. He is a full-time professional photographer for the US Army.
Photographer, Jake Seawolf, captured an aerial view of Bear Lake, USGS boat, and employees on a water-quality platform on a cold and blustery November day using a drone. Jake volunteered his time and talents with the USGS. He is a full-time professional photographer for the US Army.

Principal aquifers and wells assessed in nationwide NAWQA/GAMA groundwater quality study
Principal aquifers and wells assessed in nationwide NAWQA/GAMA groundwater quality studyMap showing principal aquifers (PAs) and wells that were sampled as part of a Nationwide assessment of the quality of groundwater used for public supply.

Piper Navajo fixed-wing aircraft with rear facing stinger magnetometer
Piper Navajo fixed-wing aircraft with rear facing stinger magnetometerA Piper Navajo fixed-wing aircraft with rear facing stinger magnetometer. Credit: New-Sense Geophysics Limited
Piper Navajo fixed-wing aircraft with rear facing stinger magnetometer
Piper Navajo fixed-wing aircraft with rear facing stinger magnetometerA Piper Navajo fixed-wing aircraft with rear facing stinger magnetometer. Credit: New-Sense Geophysics Limited

Helicopter with forward facing stinger magnetometer
Helicopter with forward facing stinger magnetometerAn AS350 helicopter with forward facing stinger magnetometer. Credit: New-Sense Geophysics Limited
Helicopter with forward facing stinger magnetometer
Helicopter with forward facing stinger magnetometerAn AS350 helicopter with forward facing stinger magnetometer. Credit: New-Sense Geophysics Limited

USGS conducts vegetation and soil research at long-term study sites in Canyonlands National Park, Utah
USGS conducts vegetation and soil research at long-term study sites in Canyonlands National Park, UtahUSGS conducts vegetation and soil drought and climatic research at long-term study sites in Canyonlands National Park, Utah in partnership with the National Park Service. This photo shows a site tour of a protected grassland that has been monitored by the USGS since 1996, with 2025 marking the 30th year of continuous data collection.