
Juvenile steelhead smolts become silvery and scales become loose as they transition into their seawater life history stages.
Images
Images intro.
Filter Total Items: 816

Juvenile steelhead smolts
Juvenile steelhead smolts become silvery and scales become loose as they transition into their seawater life history stages.

Earthquakes at Mount St. Helens from Mar. 14, 2016 - May 4, 2017
Earthquakes at Mount St. Helens from Mar. 14, 2016 - May 4, 2017Map view plot of earthquakes located by the Pacific Northwest Seismic Network from March 14, 2016 through May 4, 2016. Only high-quality locations are shown (8 or more observations with a 130 degree gap or less between observing stations).

Mount St. Helens earthquake record during times of magma recharge.
Mount St. Helens earthquake record during times of magma recharge.The top plot is the number of located earthquakes per week from the Pacific Northwest Seismic Network's catalog. The bottom plot shows the earthquake depths with time. Earthquakes are plotted as circles with the size of the circle corresponding to the magnitude of the earthquake (see legend).

USGS-CVO crew digs out Mount St. Helens' Sep. Lobe monitoring station.
USGS-CVO crew digs out Mount St. Helens' Sep. Lobe monitoring station.During the first few days of Mount St. Helen's earthquake swarm in March 2016, the September Lobe monitoring station (located on the 1980-86 dome) was buried in deep snow and not transmitting data.

Tidal marsh, Billy Frank Jr. Nisqually National Wildlife Refuge, WA.
Tidal marsh, Billy Frank Jr. Nisqually National Wildlife Refuge, WA.A tidal marsh at Billy Frank Jr. Nisqually National Wildlife Refuge, WA.
Tidal marsh, Billy Frank Jr. Nisqually National Wildlife Refuge, WA.
Tidal marsh, Billy Frank Jr. Nisqually National Wildlife Refuge, WA.A tidal marsh at Billy Frank Jr. Nisqually National Wildlife Refuge, WA.

Juvenile Chinook salmon in Cougar Reservoir
Underwater image of Juvenile Chinook salmon in Cougar Reservoir in the Willamette Basin.
Underwater image of Juvenile Chinook salmon in Cougar Reservoir in the Willamette Basin.

USGS scientist and GeoGirls viewing Mount St. Helens
USGS scientist and GeoGirls viewing Mount St. HelensUSGS scientists Kate Allstadt and Cynthia Gardner tell the story of the May 18, 1980 eruption of Mount St. Helens and how the catastrophic landslide, lateral blast, and lahar changed the landscape.

Headscarp of Red Bluffs Landslide Overlooking Crescent Lake Landslide
Headscarp of Red Bluffs Landslide Overlooking Crescent Lake LandslideView out over the Crescent Lake landslide from the headscarp (left foreground) of the Red Bluffs landslide, looking toward Stevenson, Washington and the Columbia River.

Bathymetry data of Columbia River mouth
Bathymetry data of Columbia River mouth, derived from an interferometric swath bathymetry systems survey in 2013. A) Swath map of data; B-E) sample detail pull-outs
Bathymetry data of Columbia River mouth, derived from an interferometric swath bathymetry systems survey in 2013. A) Swath map of data; B-E) sample detail pull-outs

Cableway measurement of flooding river
Cableways allow hydrologic technicians to safely measure streamflow. Here, a technician measures flood waters.
Cableways allow hydrologic technicians to safely measure streamflow. Here, a technician measures flood waters.

Debris flow in channel near Butte Camp, Mount St. Helens, WA.
Debris flow in channel near Butte Camp, Mount St. Helens, WA.Debris flow in channel near Butte Camp, Mount St. Helens, Washington.
Debris flow in channel near Butte Camp, Mount St. Helens, WA.
Debris flow in channel near Butte Camp, Mount St. Helens, WA.Debris flow in channel near Butte Camp, Mount St. Helens, Washington.

Small debris flows originating above Butte Camp, Mount St. Helens, WA
Small debris flows originating above Butte Camp, Mount St. Helens, WAPath of small debris flows originating above Butte Camp, Mount St. Helens, Washington.
Small debris flows originating above Butte Camp, Mount St. Helens, WA
Small debris flows originating above Butte Camp, Mount St. Helens, WAPath of small debris flows originating above Butte Camp, Mount St. Helens, Washington.
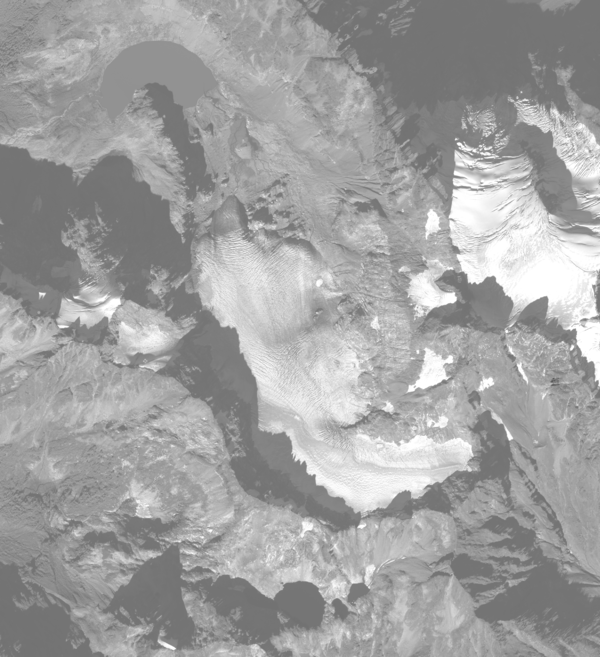
South Cascade Glacier October 14th, 2015
Aerial photograph of South Cascade Glacier, WA taken October 14th, 2015.
Aerial photograph of South Cascade Glacier, WA taken October 14th, 2015.

Measuring discharge in the Sauk River, Washington
A hydrologic technician wades across the Sauk River to measure streamflow at USGS streamgage 12186000. The staff gage in front of the boulder can be used to read the water level.
A hydrologic technician wades across the Sauk River to measure streamflow at USGS streamgage 12186000. The staff gage in front of the boulder can be used to read the water level.

South Cascade Glacier, northwestern Washington State
South Cascade Glacier, northwestern Washington StateSouth Cascade Glacier, northwestern Washington State. South Cascade Glacier located in a north-northwest facing valley near the crest of the Cascade Range in northwest Washington state. In 1959 scientists with the USGS began collecting mass balance data on South Cascade Glacier, now one of five "benchmark glaciers" in the US.

Scientist stands on the bank of a still river
USGS hydrologist Mark Reid looks at one of the many grabens (extensional basins) that formed as the Oso landslide swept across the North Fork Stillaguamish River valley.
USGS hydrologist Mark Reid looks at one of the many grabens (extensional basins) that formed as the Oso landslide swept across the North Fork Stillaguamish River valley.

Juvenile wolf eel
Juvenile wolf eel - Scuba divers from the U.S. Geological Survey’s Western Fisheries Research Center, Washington Sea Grant, EPA and the Lower Elwha Klallam Tribe collected data and images from a long-term study of the Elwha River dam removals and the resulting effects on the nearshore ecosystem.
Juvenile wolf eel - Scuba divers from the U.S. Geological Survey’s Western Fisheries Research Center, Washington Sea Grant, EPA and the Lower Elwha Klallam Tribe collected data and images from a long-term study of the Elwha River dam removals and the resulting effects on the nearshore ecosystem.

Moon snails
Moon snails - Scuba divers from the U.S. Geological Survey’s Western Fisheries Research Center, Washington Sea Grant, EPA and the Lower Elwha Klallam Tribe collected data and images from a long-term study of the Elwha River dam removals and the resulting effects on the nearshore ecosystem.
Moon snails - Scuba divers from the U.S. Geological Survey’s Western Fisheries Research Center, Washington Sea Grant, EPA and the Lower Elwha Klallam Tribe collected data and images from a long-term study of the Elwha River dam removals and the resulting effects on the nearshore ecosystem.

Salmonid in a Pacific Northwest Stream
Salmonids are inventoried during the ecosurveys done for the Regional Stream Quality Assessment (RSQA)
Salmonids are inventoried during the ecosurveys done for the Regional Stream Quality Assessment (RSQA)
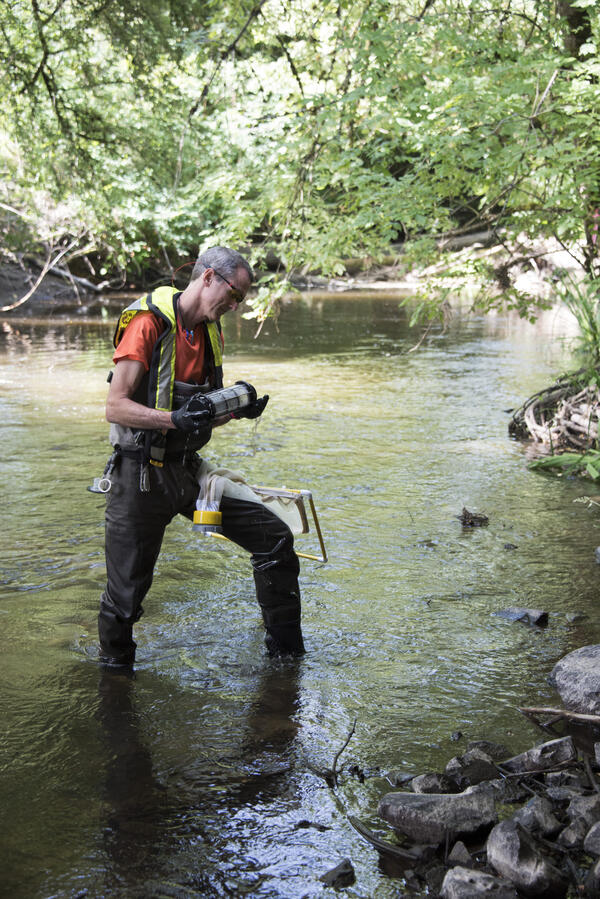
A USGS researcher takes algae samples at Bear Creek in Redmond, WA.
A USGS researcher takes algae samples at Bear Creek in Redmond, WA.A USGS researcher takes algae samples at Bear Creek in Redmond, Washington.
A USGS researcher takes algae samples at Bear Creek in Redmond, WA.
A USGS researcher takes algae samples at Bear Creek in Redmond, WA.A USGS researcher takes algae samples at Bear Creek in Redmond, Washington.

Landsat Image of Mount St. Helens on May 22, 1983
Land Remote Sensing Image of Mount St. Helens on May 22, 1983. The volcanic blast on May 18, 1980, devastated more than 150 square miles of forest within a few minutes. In this Landsat false-color images, forest appears as bright red interspersed with patches of logging. Snow appears white, and ash is gray.
Land Remote Sensing Image of Mount St. Helens on May 22, 1983. The volcanic blast on May 18, 1980, devastated more than 150 square miles of forest within a few minutes. In this Landsat false-color images, forest appears as bright red interspersed with patches of logging. Snow appears white, and ash is gray.