Map of major features in Biscuit Basin, Yellowstone National Park
Map of major features in Biscuit Basin, Yellowstone National ParkMap of major thermal features in Biscuit Basin, Yellowstone National Park. Base map from Google Earth

Official websites use .gov
A .gov website belongs to an official government organization in the United States.
Secure .gov websites use HTTPS
A lock () or https:// means you’ve safely connected to the .gov website. Share sensitive information only on official, secure websites.
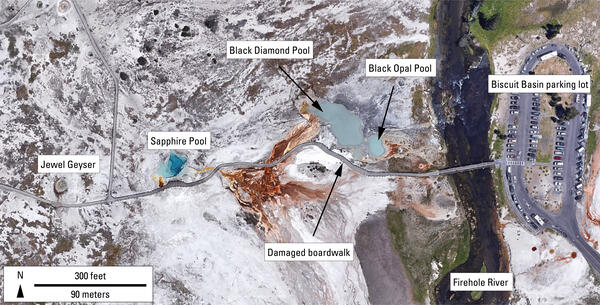
Map of major thermal features in Biscuit Basin, Yellowstone National Park. Base map from Google Earth
Map of major thermal features in Biscuit Basin, Yellowstone National Park. Base map from Google Earth

USGS geologists at a site of new sediment core in a trans-disciplinary effort to reconstruct past climate change across the country near Hannah, Wyoming, on June 26, 2024. Pictured left to right: Marci Robinson and Jean Self-Trail both Research Geologist, Northeast Region; and Marieke Dechesne, Reasearch Geologist, Rocky Mountain Region.
USGS geologists at a site of new sediment core in a trans-disciplinary effort to reconstruct past climate change across the country near Hannah, Wyoming, on June 26, 2024. Pictured left to right: Marci Robinson and Jean Self-Trail both Research Geologist, Northeast Region; and Marieke Dechesne, Reasearch Geologist, Rocky Mountain Region.

This animation shows a map of of Yellowstone seismicity by year from 2017 through 2023. Earthquakes are red circles, with the circle size indicating earthquake magnitude. Gray lines are roads, black dashed line shows the caldera boundary, Yellowstone National Park is outlined by black dot-dashed line, and gray dashed lines denote state boundaries.
This animation shows a map of of Yellowstone seismicity by year from 2017 through 2023. Earthquakes are red circles, with the circle size indicating earthquake magnitude. Gray lines are roads, black dashed line shows the caldera boundary, Yellowstone National Park is outlined by black dot-dashed line, and gray dashed lines denote state boundaries.
Front cover of the Yellowstone Volcano Observatory 2023 annual report, which includes a summary of earthquake, deformation, and geyser activity, as well as research investigations and other information. The report is freely available online athttps://pubs.usgs.gov/publication/cir1524.
Front cover of the Yellowstone Volcano Observatory 2023 annual report, which includes a summary of earthquake, deformation, and geyser activity, as well as research investigations and other information. The report is freely available online athttps://pubs.usgs.gov/publication/cir1524.
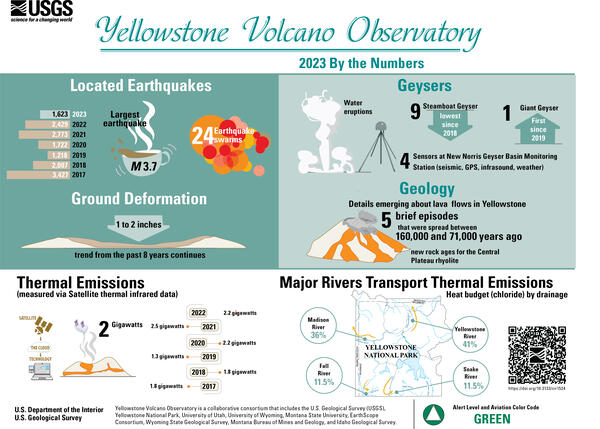
Infographic giving earthquake, deformation, thermal emission, and geyser statistics for the Yellowstone region for the year 2023. The graphic accompanies the Yellowstone Volcano Observatory 2023 annual report, freely available online athttps://pubs.usgs.gov/publication/cir1524.
Infographic giving earthquake, deformation, thermal emission, and geyser statistics for the Yellowstone region for the year 2023. The graphic accompanies the Yellowstone Volcano Observatory 2023 annual report, freely available online athttps://pubs.usgs.gov/publication/cir1524.
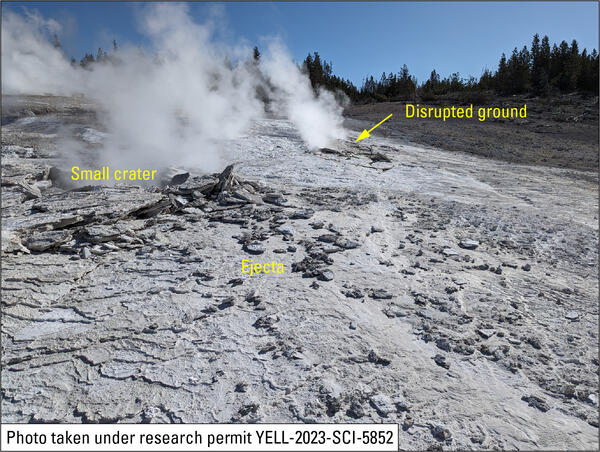
Site of April 15, 2024, hydrothermal explosion on Porcelain Terrace, Norris Geyser Basin, Yellowstone National Park. The small crater and disrupted ground are in silica sinter deposits that formed in the past two years, since water has been flowing from the terrace into Nuphar Lake (off photo to right), and angular fragments of ejecta on top of the sinter are
Site of April 15, 2024, hydrothermal explosion on Porcelain Terrace, Norris Geyser Basin, Yellowstone National Park. The small crater and disrupted ground are in silica sinter deposits that formed in the past two years, since water has been flowing from the terrace into Nuphar Lake (off photo to right), and angular fragments of ejecta on top of the sinter are

View of the vibrant, multicolored extremophilic bacteria in the outflow from Grand Prismatic Spring at the Midway Geyser Basin, Yellowstone National Park. Photo by Elizabeth Mordensky, May 12, 2024.
View of the vibrant, multicolored extremophilic bacteria in the outflow from Grand Prismatic Spring at the Midway Geyser Basin, Yellowstone National Park. Photo by Elizabeth Mordensky, May 12, 2024.

Total electron content (TEC) data—a measure of activity in the ionosphere—at three GPS stations in Yellowstone. Each line color is a measurement using a different satellite passing overhead. Note how the data are steady until the evening of May 10, 2024, when the signals start to fluctuate wildly due to the arrival of the Coronal Mass Ejection.
Total electron content (TEC) data—a measure of activity in the ionosphere—at three GPS stations in Yellowstone. Each line color is a measurement using a different satellite passing overhead. Note how the data are steady until the evening of May 10, 2024, when the signals start to fluctuate wildly due to the arrival of the Coronal Mass Ejection.

Photos of Central Plateau Member rhyolite flow structures from the Yellowstone Plateau Volcanic Field. A) An ogive from a road cut along Firehole Lake Drive. Ogives are pressure ridges that form perpendicular to the direction of flow from the compressive stresses that deform the highly viscous lava as it moves.
Photos of Central Plateau Member rhyolite flow structures from the Yellowstone Plateau Volcanic Field. A) An ogive from a road cut along Firehole Lake Drive. Ogives are pressure ridges that form perpendicular to the direction of flow from the compressive stresses that deform the highly viscous lava as it moves.
Rhyolite lava flow textures from Long Valley and Yellowstone calderas. A) Photograph of well-developed spherulites in a lava flow from Long Valley Caldera in Eastern California. This high-silica rhyolite flow is very similar to the Central Plateau Member rhyolites of the Yellowstone Plateau Volcanic Field and exhibits many of the same textures.
Rhyolite lava flow textures from Long Valley and Yellowstone calderas. A) Photograph of well-developed spherulites in a lava flow from Long Valley Caldera in Eastern California. This high-silica rhyolite flow is very similar to the Central Plateau Member rhyolites of the Yellowstone Plateau Volcanic Field and exhibits many of the same textures.
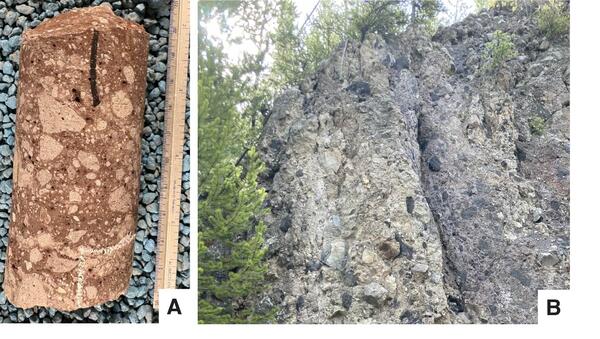
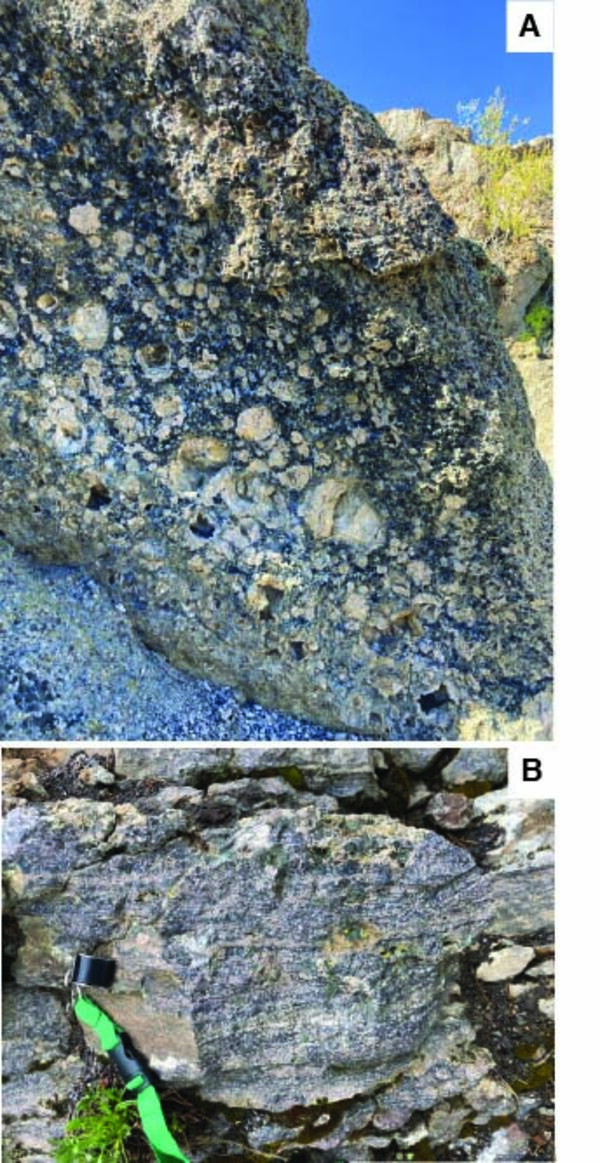
Photos of flow breccia in Central Plateau Member rhyolites in Yellowstone National Park. A) Flow breccia observed in a drill core from the Lower Geyser Basin. The angular, light-colored clasts are fragments of the original lava carapace, broken and incorporated into the flow as it advanced. B) Flow breccia exposed in a road cut along Firehole Canyon Drive.
Photos of flow breccia in Central Plateau Member rhyolites in Yellowstone National Park. A) Flow breccia observed in a drill core from the Lower Geyser Basin. The angular, light-colored clasts are fragments of the original lava carapace, broken and incorporated into the flow as it advanced. B) Flow breccia exposed in a road cut along Firehole Canyon Drive.

Seismic and infrasound data for the April 15, 2024, hydrothermal explosion on Porcelain Terrace at Norris Geyser Basin. Top plot is seismic data from the YNM station, located at the Norris Geyser Basin Museum. Middle plot is seismic data from station YNB, in the Ragged Hills of Norris Geyser Basin. Bottom plot is infrasound data from station YNB.&nb
Seismic and infrasound data for the April 15, 2024, hydrothermal explosion on Porcelain Terrace at Norris Geyser Basin. Top plot is seismic data from the YNM station, located at the Norris Geyser Basin Museum. Middle plot is seismic data from station YNB, in the Ragged Hills of Norris Geyser Basin. Bottom plot is infrasound data from station YNB.&nb

Plot showing the total geothermal radiant power output from Yellowstone’s thermal areas based on Landsat 8 and Landsat 9 thermal infrared images from 2014 to 2024. Only data from clear, nighttime, wintertime (November through March) dates were used. The results indicate that there has been no significant change over the last 10 years.
Plot showing the total geothermal radiant power output from Yellowstone’s thermal areas based on Landsat 8 and Landsat 9 thermal infrared images from 2014 to 2024. Only data from clear, nighttime, wintertime (November through March) dates were used. The results indicate that there has been no significant change over the last 10 years.

Plots showing the number of water samples collected over time (top) and by location (bottom) in the Yellowstone region since the late 1800s. Yellowstone’s archive of water-chemistry research data is a mosaic of scientific progress, built with the work of hundreds of people over more than a century and still growing today.
Plots showing the number of water samples collected over time (top) and by location (bottom) in the Yellowstone region since the late 1800s. Yellowstone’s archive of water-chemistry research data is a mosaic of scientific progress, built with the work of hundreds of people over more than a century and still growing today.

High-resolution satellite images of Norris Geyser Basin showing the area of Porcelain Basin and Nuphar Lake in April 2024. In the left image, acquired on April 2, 2024, springs on Porcelain Terrace are full of water, and warm hydrothermal water is flowing into Nuphar Lake, keeping the north part of the lake free of ice. Boardwalks in the area appear as w
High-resolution satellite images of Norris Geyser Basin showing the area of Porcelain Basin and Nuphar Lake in April 2024. In the left image, acquired on April 2, 2024, springs on Porcelain Terrace are full of water, and warm hydrothermal water is flowing into Nuphar Lake, keeping the north part of the lake free of ice. Boardwalks in the area appear as w

History of travertine deposition in Yellowstone caldera and correlation with past climate conditions. a) The age of travertine samples (based on the U-230Th geochronometer) from Old Hillside Springs, Hillside Springs, North Hillside Springs, and Morning Glory in Upper Geyser Basin and from Firehole Lake in Lower Geyser Basin.
History of travertine deposition in Yellowstone caldera and correlation with past climate conditions. a) The age of travertine samples (based on the U-230Th geochronometer) from Old Hillside Springs, Hillside Springs, North Hillside Springs, and Morning Glory in Upper Geyser Basin and from Firehole Lake in Lower Geyser Basin.

Schematic illustrating the conditions under which some travertine forms in Yellowstone caldera.
Schematic illustrating the conditions under which some travertine forms in Yellowstone caldera.
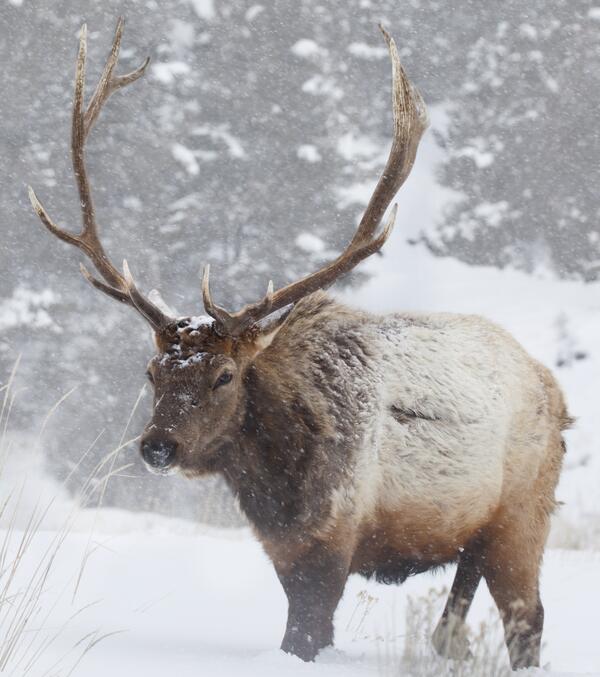
Photo of a bull elk wintering in Yellowstone National Park. Photo by Elizabeth Mordensky, March 5, 2024.
Photo of a bull elk wintering in Yellowstone National Park. Photo by Elizabeth Mordensky, March 5, 2024.

Sagebrush Collaborative Restoration Landscapes capture over a third of the remaining intact Core Sagebrush Areas across the sagebrush biome.
Layer Sources
Sagebrush Collaborative Restoration Landscapes capture over a third of the remaining intact Core Sagebrush Areas across the sagebrush biome.
Layer Sources

Sagebrush Collaborative Restoration Landscapes capture over a third of the remaining intact Core Sagebrush Areas across the sagebrush biome.
Sagebrush Collaborative Restoration Landscapes capture over a third of the remaining intact Core Sagebrush Areas across the sagebrush biome.

Melt inclusions (<50 micrometers in diameter) in a quartz crystal from the Huckleberry Ridge Tuff, erupted 2.1 million years ago. Photomicrograph taken by Behnaz Hosseini at Montana State University.
Melt inclusions (<50 micrometers in diameter) in a quartz crystal from the Huckleberry Ridge Tuff, erupted 2.1 million years ago. Photomicrograph taken by Behnaz Hosseini at Montana State University.