U.S. flag

An official website of the United States government

Images

Images intro.
Filter Total Items: 734
Histogram of Yellowstone earthquakes during 1973-2023

Histogram showing the number of earthquakes per 3-month period (quarter) in the Yellowstone region during 1973–2023.  Red bars represent all earthquakes located in the area, and blue bars indicate swarm seismicity.

Histogram showing the number of earthquakes per 3-month period (quarter) in the Yellowstone region during 1973–2023.  Red bars represent all earthquakes located in the area, and blue bars indicate swarm seismicity.
Map of Yellowstone earthquakes that were located during 1973-2023

Map of Yellowstone earthquakes that were located during 1973-2023. Red circles are earthquakes located in the Yellowstone region, and blue circles indicate swarm seismicity.  The size of the circle scales with the magnitude of the earthquake.

Map of Yellowstone earthquakes that were located during 1973-2023. Red circles are earthquakes located in the Yellowstone region, and blue circles indicate swarm seismicity.  The size of the circle scales with the magnitude of the earthquake.

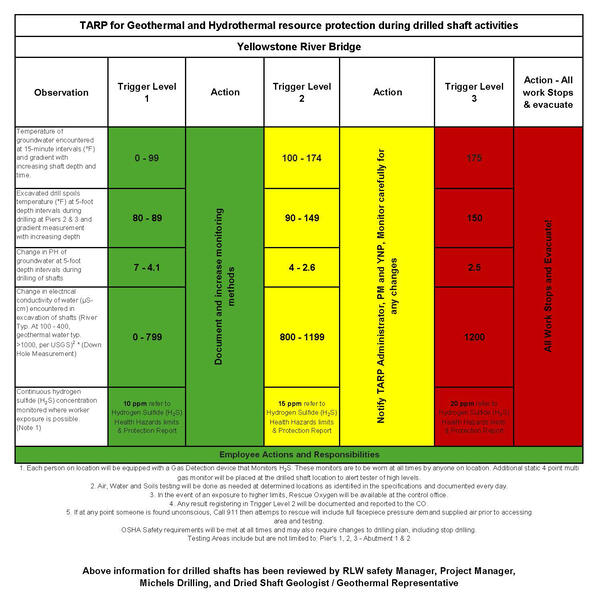
Table showing types of geothermal data and levels at which different responses are required, colored red-yellow-green according to severity
Trigger Action Response Plan for the Yellowstone River Bridge project

Trigger Action Response Plan (TARP) for the Yellowstone River Bridge replacement project.  The plan gives three levels of response for various conditions that might be encountered during drilling of bridge footings.  The level of severity is indicated by the colors, with green being least severe and red being most severe.

Trigger Action Response Plan (TARP) for the Yellowstone River Bridge replacement project.  The plan gives three levels of response for various conditions that might be encountered during drilling of bridge footings.  The level of severity is indicated by the colors, with green being least severe and red being most severe.

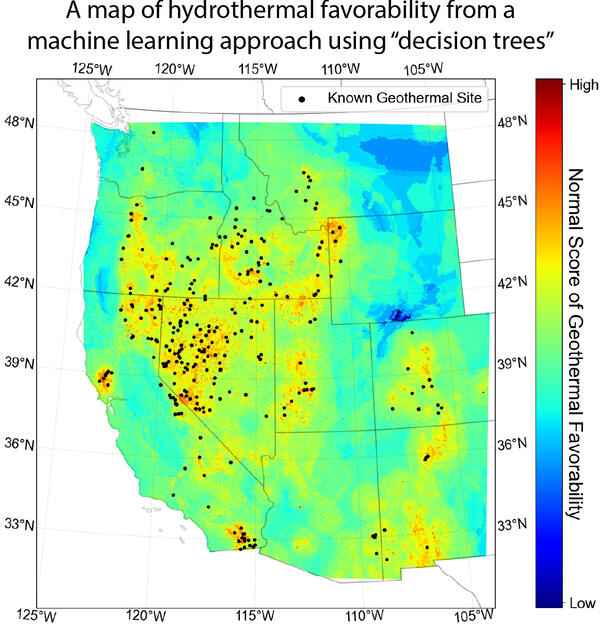
Map of western USA with colors indicating likelihood of hydrothermal activity
Map of areas predicted as having conditions favorable for fostering a hydrothermal system in the western United States

Map of areas predicted as having conditions favorable for fostering a hydrothermal system in the western United States.  Black dots are mapped hydrothermal systems.  From Mordensky et al., 2023 (https://www.sciencedirect.com/science/article/pii/S0375650523000160).

Map of earthquakes in the Yellowstone National Park region in 2023

Map of seismicity (red circles) in the Yellowstone region during 2023. Gray lines are roads, black dashed line shows the caldera boundary, Yellowstone National Park is outlined by black dot-dashed line, and gray dashed lines denote state boundaries.

Map of seismicity (red circles) in the Yellowstone region during 2023. Gray lines are roads, black dashed line shows the caldera boundary, Yellowstone National Park is outlined by black dot-dashed line, and gray dashed lines denote state boundaries.

Infrasound data from Norris Geyser Basin showing November 13, 2023, eruption of Steamboat Geyser

Infrasound-array processing for the newly installed station YNB, at Norris Geyser Basin. Top panel shows the pressure waveform from one of the three elements that comprise the array, filtered between 1 and 15 Hz. Bottom panel shows the backazimuth from the station to the source.

Infrasound-array processing for the newly installed station YNB, at Norris Geyser Basin. Top panel shows the pressure waveform from one of the three elements that comprise the array, filtered between 1 and 15 Hz. Bottom panel shows the backazimuth from the station to the source.

Thermal imagery from near Beryl Spring, Yellowstone National Park, showing heat from a buried pipe

Thermal imagery from near Beryl Spring showing heat from a buried pipe that vents steam from the concrete containment box built in1962 around a spring that opened in the adjacent roadbed in 1942. National Park Service photo by Erin Dundas, November 8, 2023.

Flagg Ranch exposure of the Lava Creek Tuff

Flagg Ranch exposure showing lower unknown ignimbrite (ash flow), the Lava Creek Tuff (LCT) ash fall deposit, and upper ignimbrite of the LCT. Thanks to work by Montana State University geologists, it is now known that the unknown ignimbrite was deposited immediately prior to the ash fall, with no significant time gap in between.

Flagg Ranch exposure showing lower unknown ignimbrite (ash flow), the Lava Creek Tuff (LCT) ash fall deposit, and upper ignimbrite of the LCT. Thanks to work by Montana State University geologists, it is now known that the unknown ignimbrite was deposited immediately prior to the ash fall, with no significant time gap in between.

Flagg Ranch exposure of the Lava Creek Tuff with quartz-hosted melt inclusions

Photo of ash-fall deposit of the Lava Creek Tuff overlying the lower “unknown” ignimbrite (an ash-flow unit, denoted by light yellow box).  Images of quartz-hosted melt inclusions show fully “baked” (dark) melt inclusions in the lowest ash fall layers (1–2).

Photo of ash-fall deposit of the Lava Creek Tuff overlying the lower “unknown” ignimbrite (an ash-flow unit, denoted by light yellow box).  Images of quartz-hosted melt inclusions show fully “baked” (dark) melt inclusions in the lowest ash fall layers (1–2).

Scanning electron microscope (SEM) photograph of a diatom on a lodgepole pine needle from Upper Geyser Basin, Yellowstone National Park

Scanning electron microscope (SEM) photograph of a diatom on a lodgepole pine needle from Upper Geyser Basin. A 10 micrometer (µm) scale is shown at the bottom of the image (slightly less than the width of human hair).

River levels and vertical deformation of Yellowstone caldera during 2016–2022

River levels and vertical deformation of Yellowstone caldera during 2016–2022.  River level (blue) was measured at the Corwin Springs gaging station on the Yellowstone River, just north of Yellowstone National Park.  Vertical deformation (red) is from the WLWY GPS station on the east side of Yellowstone caldera.  The GPS data indicate overall subsiden

River levels and vertical deformation of Yellowstone caldera during 2016–2022.  River level (blue) was measured at the Corwin Springs gaging station on the Yellowstone River, just north of Yellowstone National Park.  Vertical deformation (red) is from the WLWY GPS station on the east side of Yellowstone caldera.  The GPS data indicate overall subsiden

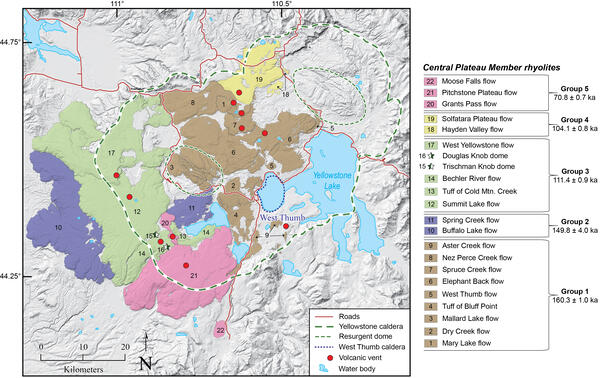
Map of Yellowstone caldera showing the locations and ages of the most recent rhyolite eruptions at Yellowstone, the Central Plateau Member rhyolites
Map of Yellowstone caldera showing the locations and ages of the Central Plateau Member rhyolites

Map of Yellowstone caldera showing the locations and ages of the most recent rhyolite eruptions at Yellowstone, the Central Plateau Member rhyolites. Unit boundaries are from Christiansen (2001).

Panel Discussion at USGS ASIST Project Tribal Drought Issues Open House, Albuquerque, NM, Sept. 26, 2023

Photograph of Panel Discussion at USGS ASIST Project Open House related to Drought Issues in Tribal Lands in and near the Colorado River Basin, held at the Southwestern Indian Polytechnic Institute, Albuquerque, New Mexico, September 26, 2023

Bison in Yellowstone National Park

Bison in Yellowstone National Park. USGS photo by Jennifer Lewicki, September 20, 2023.

A large circular area of water with multiple colors ranging from blue color and spanning outward to orange. Steam rises above
Grand Prismatic Spring

A view of the Grand Prismatic Hot Spring from the vantage point of the Grand Prismatic Overlook Trail in Yellowstone National Park, Wyoming. 

A view of the Grand Prismatic Hot Spring from the vantage point of the Grand Prismatic Overlook Trail in Yellowstone National Park, Wyoming. 

A large herd of bison travel through an open field while the sun sets in the distance over the mountains.
Bison Field
Bison Field
Bison Field

A herd of bison strolls through an open meadow close to sunset in Yellowstone National Park, Wyoming.

A herd of bison strolls through an open meadow close to sunset in Yellowstone National Park, Wyoming.

A tall stream of water erupts from Old Faithful geyser in the distance. People stand on a walkway watching.
Old Faithful
Old Faithful
Old Faithful

The famous Old Faithful geyser begins an eruption as visitors watch in the distance. This view is looking from Beehive Geyser toward Old Faithful.

The famous Old Faithful geyser begins an eruption as visitors watch in the distance. This view is looking from Beehive Geyser toward Old Faithful.

Yellowish bacteria in water flows out of a blue colored hot spring in the shape of an ear.
Ear Spring
Ear Spring
Ear Spring

"Ear Spring is a truly hot spring, with surface water temperatures often above the boiling point of 198°F (92°C) at this elevation. True to its name, this pool is shaped somewhat like an ear." - NPS

"Ear Spring is a truly hot spring, with surface water temperatures often above the boiling point of 198°F (92°C) at this elevation. True to its name, this pool is shaped somewhat like an ear." - NPS

A sunset peaking out over a small, woody, hill.
Yellowstone Sunset
Yellowstone Sunset
Yellowstone Sunset

A picturesque shot of the sun setting while driving through north Yellowstone National Park, Wyoming.

A picturesque shot of the sun setting while driving through north Yellowstone National Park, Wyoming.

A rainbow rises to the right over the fumes of two geysers nearby.
Rainbow over Ledge Geyser

A rainbow rises over Ledge Geyser in Yellowstone National Park, Wyoming. "Ledge is the second largest geyser in the Norris Geyser Basin, capable of shooting water 125 feet into the air. Because it erupts at an angle, however, the water will sometimes reach the ground 220 feet away." - NPS

A rainbow rises over Ledge Geyser in Yellowstone National Park, Wyoming. "Ledge is the second largest geyser in the Norris Geyser Basin, capable of shooting water 125 feet into the air. Because it erupts at an angle, however, the water will sometimes reach the ground 220 feet away." - NPS

A stream of water and steam erupts from a geyser while a rainbow crosses over top.
Castle Geyser
Castle Geyser
Castle Geyser

A view of Castle Geyser erupting as a rainbow rises out and over the eruption. Castle Geyser is located in the Upper Geyser Basin of Yellowstone National Park, Wyoming.

A view of Castle Geyser erupting as a rainbow rises out and over the eruption. Castle Geyser is located in the Upper Geyser Basin of Yellowstone National Park, Wyoming.

Was this page helpful?