USGS Earth Explorer screen shot with Landsat 8 data from Yellowstone
USGS Earth Explorer screen shot with Landsat 8 data from YellowstoneUSGS Earth Explorer screen shot showing example of Landsat 8 search results over Yellowstone.

Official websites use .gov
A .gov website belongs to an official government organization in the United States.
Secure .gov websites use HTTPS
A lock () or https:// means you’ve safely connected to the .gov website. Share sensitive information only on official, secure websites.
Images of Yellowstone.

USGS Earth Explorer screen shot showing example of Landsat 8 search results over Yellowstone.
USGS Earth Explorer screen shot showing example of Landsat 8 search results over Yellowstone.

Screen shot of the USGS Earth Explorer web tool showing an example of the geographic area and date range search criteria for Yellowstone.
Screen shot of the USGS Earth Explorer web tool showing an example of the geographic area and date range search criteria for Yellowstone.

Site of the former Fountain Hotel in Yellowstone National Park. Red arrows indicate the location of the pipe that ran through the meadow between Leather Pool and the site of the Fountain Hotel (yellow arrow). Yellowstone National Park photo by Annie Carlson, October 2021.
Site of the former Fountain Hotel in Yellowstone National Park. Red arrows indicate the location of the pipe that ran through the meadow between Leather Pool and the site of the Fountain Hotel (yellow arrow). Yellowstone National Park photo by Annie Carlson, October 2021.

Shaded relief map of Henrys Fork Caldera and vicinity. The margin of Henrys Fork Caldera is shown in blue. Note the smooth, low-relief topography within the caldera compared to the steep and dynamic topography associated with Yellowstone Caldera (at the right side of the image).
Shaded relief map of Henrys Fork Caldera and vicinity. The margin of Henrys Fork Caldera is shown in blue. Note the smooth, low-relief topography within the caldera compared to the steep and dynamic topography associated with Yellowstone Caldera (at the right side of the image).

Interferogram created from data collected on September 22, 2020, and September 17, 2021, by the Sentinel-1 satellite system. Colored fringes indicate a change in distance (called range change) between the satellite and ground surface that is caused by surface deformation.
Interferogram created from data collected on September 22, 2020, and September 17, 2021, by the Sentinel-1 satellite system. Colored fringes indicate a change in distance (called range change) between the satellite and ground surface that is caused by surface deformation.

Pore waters from Yellowstone Lake sediment cores collected in August 2021 are extracted through filtration devices into plastic syringes. Note that the second core from the left appears light in color because the plastic core liner was etched by very hot 91°C (196°F) fluids.
Pore waters from Yellowstone Lake sediment cores collected in August 2021 are extracted through filtration devices into plastic syringes. Note that the second core from the left appears light in color because the plastic core liner was etched by very hot 91°C (196°F) fluids.

Gravity coring device on the rear deck of the R/V Annie after coring the floor of Yellowstone Lake, with dark mud coating the outside of the corer. The 100-lb. green coring head is at the top, and the bottom of the barrel has a tapered stainless steel core cutter.
Gravity coring device on the rear deck of the R/V Annie after coring the floor of Yellowstone Lake, with dark mud coating the outside of the corer. The 100-lb. green coring head is at the top, and the bottom of the barrel has a tapered stainless steel core cutter.

View to the aft of the R/V Annie as it leaves Bridge Bay Marina early in the morning of August 26, 2021.
View to the aft of the R/V Annie as it leaves Bridge Bay Marina early in the morning of August 26, 2021.

A hand-sample photo of what is known to be Lava Creek Tuff “unit 2.” Small black scoria pieces are distinctive of this unit compared to the previously recognized Member A and Member B of the Lava Creek Tuff. Photo by Ray Salazar (Montana State University) on August 16, 2021.
A hand-sample photo of what is known to be Lava Creek Tuff “unit 2.” Small black scoria pieces are distinctive of this unit compared to the previously recognized Member A and Member B of the Lava Creek Tuff. Photo by Ray Salazar (Montana State University) on August 16, 2021.

Schematic displaying the general processes associated with collapse of Yellowstone Caldera. (A) Pre-caldera volcanism includes the eruption of dome complexes from the underlying magma chambers. (B) The caldera-forming eruption evacuates a significant amount of magma from the chamber, causing the overlying crustal block to subside into the void space.&nbs
Schematic displaying the general processes associated with collapse of Yellowstone Caldera. (A) Pre-caldera volcanism includes the eruption of dome complexes from the underlying magma chambers. (B) The caldera-forming eruption evacuates a significant amount of magma from the chamber, causing the overlying crustal block to subside into the void space.&nbs

“Hey Bear” volcano, Wyoming, with Raggedtop Mountain in the background. Hey Bear volcano is a small scoria cone that is about 1.3 million years old and that erupted over Eocene (~50 million-year-old) rocks (noted by yellow dotted line). Photo by Matthew Brueseke, Kansas State University, August 2021, used with permission.
“Hey Bear” volcano, Wyoming, with Raggedtop Mountain in the background. Hey Bear volcano is a small scoria cone that is about 1.3 million years old and that erupted over Eocene (~50 million-year-old) rocks (noted by yellow dotted line). Photo by Matthew Brueseke, Kansas State University, August 2021, used with permission.

Photograph of Twin Buttes in Lower Geyser Basin looking to the northwest, with Excelsior Geyser of Midway Geyser Basin in the foreground. Twin Buttes is a thermal kame that formed when glaciers covered the area, and hydrothermal activity below the ice led to melting and the deposition and cementation of glacial sediments.
Photograph of Twin Buttes in Lower Geyser Basin looking to the northwest, with Excelsior Geyser of Midway Geyser Basin in the foreground. Twin Buttes is a thermal kame that formed when glaciers covered the area, and hydrothermal activity below the ice led to melting and the deposition and cementation of glacial sediments.

The Yellowstone borehole geophysical network, installed by UNAVCO in 2007–2008. The placement of the boreholes is focused primarily around the caldera, and the boreholes contain a mix of instruments, including strainmeters, seismometers, tiltmeters, and pore pressure sensors.
The Yellowstone borehole geophysical network, installed by UNAVCO in 2007–2008. The placement of the boreholes is focused primarily around the caldera, and the boreholes contain a mix of instruments, including strainmeters, seismometers, tiltmeters, and pore pressure sensors.

Imperial Geyser, Lower Geyser Basin, Yellowstone National Park. USGS photo by Lauren Harrison, July 2021.
Imperial Geyser, Lower Geyser Basin, Yellowstone National Park. USGS photo by Lauren Harrison, July 2021.

Visible and thermal infrared images of Yellowstone acquired on July 17, 2021. In the visible image, Landsat 8 channels 4-3-2 are assigned red-green-blue colors (respectively) to simulate natural color. In thermal infrared image, bright pixels are warmer, and dark pixels are cooler. The full satellite images are clipped to the boundaries of Yellowst
Visible and thermal infrared images of Yellowstone acquired on July 17, 2021. In the visible image, Landsat 8 channels 4-3-2 are assigned red-green-blue colors (respectively) to simulate natural color. In thermal infrared image, bright pixels are warmer, and dark pixels are cooler. The full satellite images are clipped to the boundaries of Yellowst

Seismogram from station YTP in Yellowstone National Park showing earthquakes from the swarm beneath Yellowstone Lake that began late on July 15, 2021. Each row represents 30 minutes of seismic data.
Seismogram from station YTP in Yellowstone National Park showing earthquakes from the swarm beneath Yellowstone Lake that began late on July 15, 2021. Each row represents 30 minutes of seismic data.
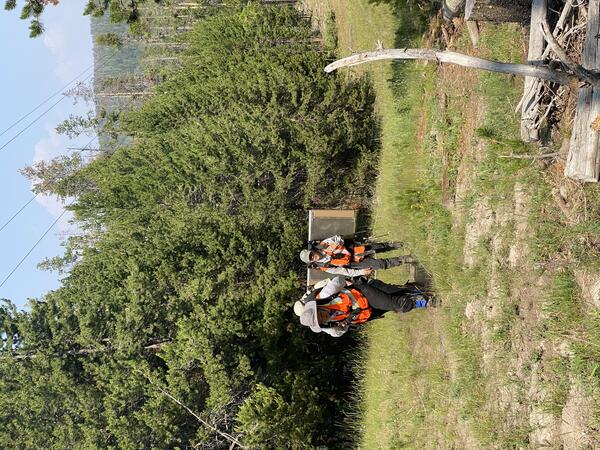
USGS scientists Laura Dobeck and Sara Peek carrying field equipment to set up a gas monitoring station in Yellowstone National Park. USGS photo by Jennifer Lewicki, July 13, 2021.
USGS scientists Laura Dobeck and Sara Peek carrying field equipment to set up a gas monitoring station in Yellowstone National Park. USGS photo by Jennifer Lewicki, July 13, 2021.

Geologic block-diagram and conceptual model of possible flow systems associated with thermal areas at Mammoth Hot Spring (MHS) area from Sorey (1991) (USGS Water-Resources Investigations Report 91-4052). Also shown are the Bear Creek Hot Springs (BC) and La Duke Hot Spring (LD).
Geologic block-diagram and conceptual model of possible flow systems associated with thermal areas at Mammoth Hot Spring (MHS) area from Sorey (1991) (USGS Water-Resources Investigations Report 91-4052). Also shown are the Bear Creek Hot Springs (BC) and La Duke Hot Spring (LD).

Epicenters of 6,188 earthquakes in the Hebgen Lake region since 1990 determined by the University of Utah Seismograph Stations and the Montana Bureau of Mines and Geology. All epicenters have horizontal uncertainties of 1.0 km or less.
Epicenters of 6,188 earthquakes in the Hebgen Lake region since 1990 determined by the University of Utah Seismograph Stations and the Montana Bureau of Mines and Geology. All epicenters have horizontal uncertainties of 1.0 km or less.

Comparison of Porkchop Geyser in September 1984 (left) and August 1986 (right). The Geyser entered a period of near-constant eruption in 1985, and the pool disappeared; it exploded on September 5, 1989.
Comparison of Porkchop Geyser in September 1984 (left) and August 1986 (right). The Geyser entered a period of near-constant eruption in 1985, and the pool disappeared; it exploded on September 5, 1989.

Map of Yellowstone National Park showing the major rivers and the continental divide (red dashed). Yellowstone Caldera is oulined by purple dashed line. Water flowing south and west of the divide ends up in the Pacific Ocean, whereas water north and east of the divide ends up in the Gulf of Mexico.
Map of Yellowstone National Park showing the major rivers and the continental divide (red dashed). Yellowstone Caldera is oulined by purple dashed line. Water flowing south and west of the divide ends up in the Pacific Ocean, whereas water north and east of the divide ends up in the Gulf of Mexico.