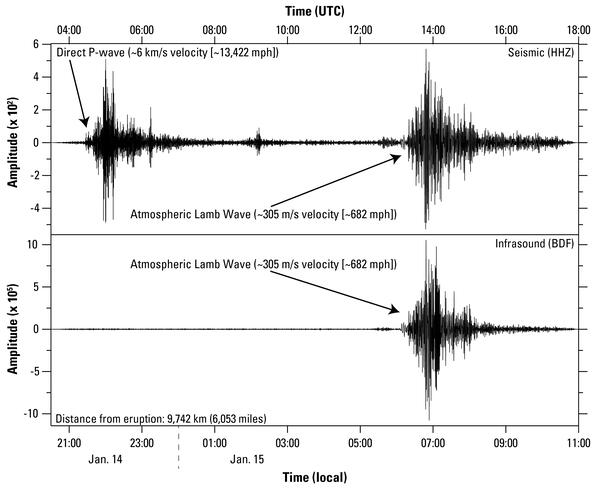
The Yellowstone borehole geophysical network, installed by UNAVCO in 2007–2008. The placement of the boreholes is focused primarily around the caldera, and the boreholes contain a mix of instruments, including strainmeters, seismometers, tiltmeters, and pore pressure sensors.
Images
Images of Yellowstone.
The Yellowstone borehole geophysical network, installed by UNAVCO in 2007–2008. The placement of the boreholes is focused primarily around the caldera, and the boreholes contain a mix of instruments, including strainmeters, seismometers, tiltmeters, and pore pressure sensors.
Imperial Geyser, Lower Geyser Basin, Yellowstone National Park
Imperial Geyser, Lower Geyser Basin, Yellowstone National ParkImperial Geyser, Lower Geyser Basin, Yellowstone National Park. USGS photo by Lauren Harrison, July 2021.
Imperial Geyser, Lower Geyser Basin, Yellowstone National Park
Imperial Geyser, Lower Geyser Basin, Yellowstone National ParkImperial Geyser, Lower Geyser Basin, Yellowstone National Park. USGS photo by Lauren Harrison, July 2021.
Landsat 8 visible and thermal infrared images of Yellowstone
Landsat 8 visible and thermal infrared images of YellowstoneVisible and thermal infrared images of Yellowstone acquired on July 17, 2021. In the visible image, Landsat 8 channels 4-3-2 are assigned red-green-blue colors (respectively) to simulate natural color. In thermal infrared image, bright pixels are warmer, and dark pixels are cooler. The full satellite images are clipped to the boundaries of Yellowst
Seismogram from station YTP in Yellowstone on July 15-16, 2021
Seismogram from station YTP in Yellowstone on July 15-16, 2021Seismogram from station YTP in Yellowstone National Park showing earthquakes from the swarm beneath Yellowstone Lake that began late on July 15, 2021. Each row represents 30 minutes of seismic data.
USGS scientists carrying field equipment to set up a gas monitoring station in Yellowstone National Park
USGS scientists carrying field equipment to set up a gas monitoring station in Yellowstone National ParkUSGS scientists Laura Dobeck and Sara Peek carrying field equipment to set up a gas monitoring station in Yellowstone National Park. USGS photo by Jennifer Lewicki, July 13, 2021.
Geologic block-diagram and conceptual model of Mammoth Hot Springs
Geologic block-diagram and conceptual model of Mammoth Hot SpringsGeologic block-diagram and conceptual model of possible flow systems associated with thermal areas at Mammoth Hot Spring (MHS) area from Sorey (1991) (USGS Water-Resources Investigations Report 91-4052). Also shown are the Bear Creek Hot Springs (BC) and La Duke Hot Spring (LD).
Hebgen Lake recent seismicity and 1959 deformation
Hebgen Lake recent seismicity and 1959 deformationEpicenters of 6,188 earthquakes in the Hebgen Lake region since 1990 determined by the University of Utah Seismograph Stations and the Montana Bureau of Mines and Geology. All epicenters have horizontal uncertainties of 1.0 km or less.
Comparison of Porkchop Geyser in Sep 1984 (left) and Aug 1986 (right)
Comparison of Porkchop Geyser in Sep 1984 (left) and Aug 1986 (right)Comparison of Porkchop Geyser in September 1984 (left) and August 1986 (right). The Geyser entered a period of near-constant eruption in 1985, and the pool disappeared; it exploded on September 5, 1989.
Map of Yellowstone showing major rivers and continental divide
Map of Yellowstone showing major rivers and continental divideMap of Yellowstone National Park showing the major rivers and the continental divide (red dashed). Yellowstone Caldera is oulined by purple dashed line. Water flowing south and west of the divide ends up in the Pacific Ocean, whereas water north and east of the divide ends up in the Gulf of Mexico.
Various paths of taken by water originating in Yellowstone
Various paths of taken by water originating in YellowstoneUpper map shows the flow path of hot spring water from the Old Faithful area through the Firehole, Madison, Missouri and Mississippi Rivers to the Gulf of Mexico. Lower map shows the flow path of hot spring water from south of the continental divide through the Lewis, Snake and Columbia Rivers to the Pacific Ocean.
Cartoon showing differences between magma- and water-driven swarms
Cartoon showing differences between magma- and water-driven swarmsSimplified cartoon showing differences between patterns of earthquakes expected for a swarm driven by a magma-filled crack (left) versus one driven by pressurized water in a fault (right).
View of Monument Geyser Basin in Yellowstone National Park, with one of the silica spire "monuments" (from which the basin gets its name) in the foreground. USGS photo by Mike Poland, May 15, 2021.
Roaring Mountain, an acid-sulfate thermal area about 5 miles south of Norris Geyser Basin along the Norris-Mammoth road. At times during the late 1800s and early 1900s, the sound of gas escaping from vents could be heard over a mile away, but today the thermal area is mostly quiet, although remains intensely hot with over 100 megawatts of geothermal radiative
The two dominant rock types found on Mount Everts, Yellowstone National Park
The two dominant rock types found on Mount Everts, Yellowstone National ParkPhotographs of the two dominant rock types found on Mount Everts: the Everts Formation (photo by Natali Kragh, May 18, 2021) and the Landslide Creek Formation (photo by Emma Kerins, May 2021). Notice the difference in scale between these two units, indicated by the pencil and field book.
Travertine sample from the Hillside Springs Group in Upper Geyser Basin, sampled under permit YELL-2020-SCI-8030. (Left) Cut and polished sample slab showing the different layers of travertine; dashed circles indicate where subsamples were taken for geochronology analysis.
Photographs of travertine in Yellowstone. A) Travertine terraces actively forming at Mammoth Hot Springs.
Location of major travertine deposits in Yellowstone National Park
Location of major travertine deposits in Yellowstone National ParkMap of Yellowstone National Park showing the location of major travertine deposits. The green dashed line is the outline of Yellowstone Caldera and red lines are major paved roads.
Visible/thermal maps of Brimstone Basin & Midway/Lower Geyser Basins
Visible/thermal maps of Brimstone Basin & Midway/Lower Geyser BasinsVisible and thermal maps of Brimstone Basin (top) and Midway / Lower Geyser Basins (bottom). The images on the left are high-resolution (1-m pixels) visible images acquired by the NAIP program in 2019. In these images, the extent of the bright white surface cover is visual evidence for the thermal area, and the yellow thermal area boundaries have been di
Map of Yellowstone’s thermal areas. Thermally active thermal areas (known to have thermal features with above-background temperatures) are shown in red. Inactive and cold, degassing thermal areas are shown in blue. Areas that are unknown or inconclusive in terms of their thermal activity are shown in purple.
Seismic view of Steamboat Geyser and Cistern Spring
Seismic view of Steamboat Geyser and Cistern SpringOutline of the Steamboat and Cistern plumbing systems. The structure, color-coded by depth, delineates the observed seismically active area during eruption cycles of Steamboat Geyser. The solid star, solid square, and open triangles denote Steamboat Geyser, Cistern Spring, and seismic station locations on the surface, respectively.
Outline of the Steamboat and Cistern plumbing systems from seismicity
Outline of the Steamboat and Cistern plumbing systems from seismicityOutline of the Steamboat and Cistern plumbing systems, with two viewing angles. The structure, color-coded by depth, delineates the observed seismically active area during eruption cycles of Steamboat Geyser. The solid star, solid square, and open triangles denote Steamboat Geyser, Cistern Spring, and seismic station locations on the surface, respectively.