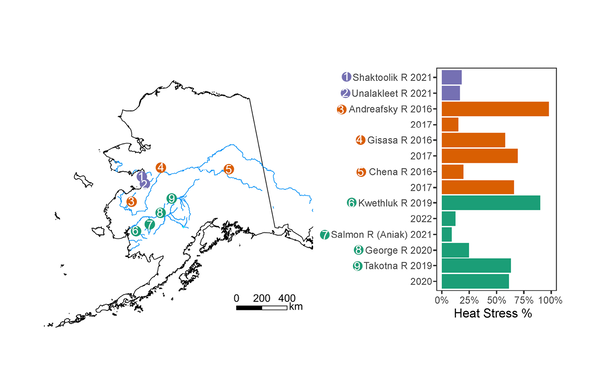
Biologists conducting marine bird and mammal surveys in Kachemak Bay, Alaska
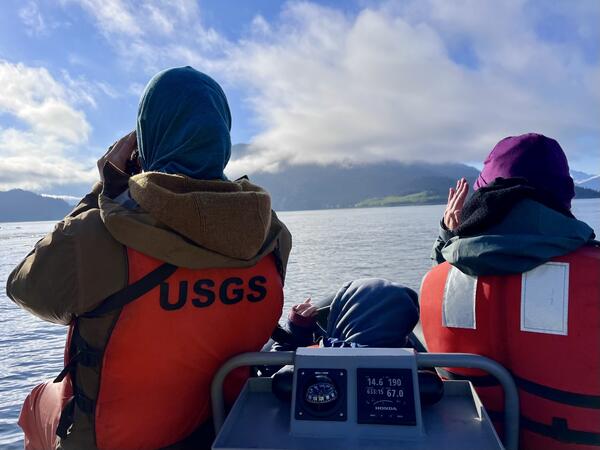
Biologists conducting marine bird and mammal surveys in Kachemak Bay, AlaskaTwo USGS biologists conducting marine bird and mammal surveys as part of the Exxon Valdez Oil Spill (EVOS) Long Term Monitoring program. The surveys provide estimates of the species composition, relative abundance, and distribution of all marine birds and mammals within the nearshore zone.