
Aerial imagery showing the location of Flagstaff, Arizona and Meteor Crater. Arrows point to Flagstaff on the left and Meteor Crater on the right.
Images
Browse here for some of our available imagery. We may get permission to use some non-USGS images and these should be marked and are subject to copyright laws. USGS Astrogeology images can be freely downloaded.
Filter Total Items: 330
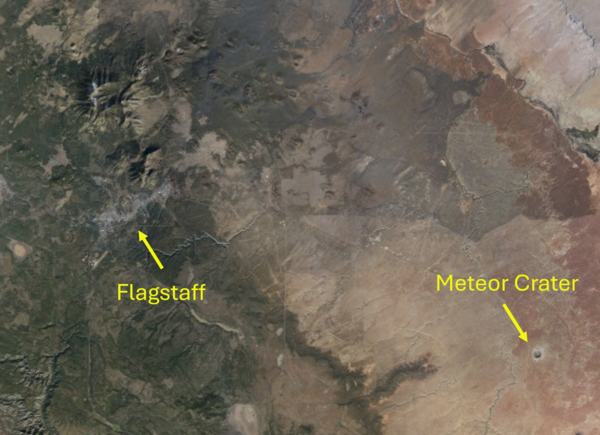
Flagstaff, Arizona and Meteor Crater
Aerial imagery showing the location of Flagstaff, Arizona and Meteor Crater. Arrows point to Flagstaff on the left and Meteor Crater on the right.
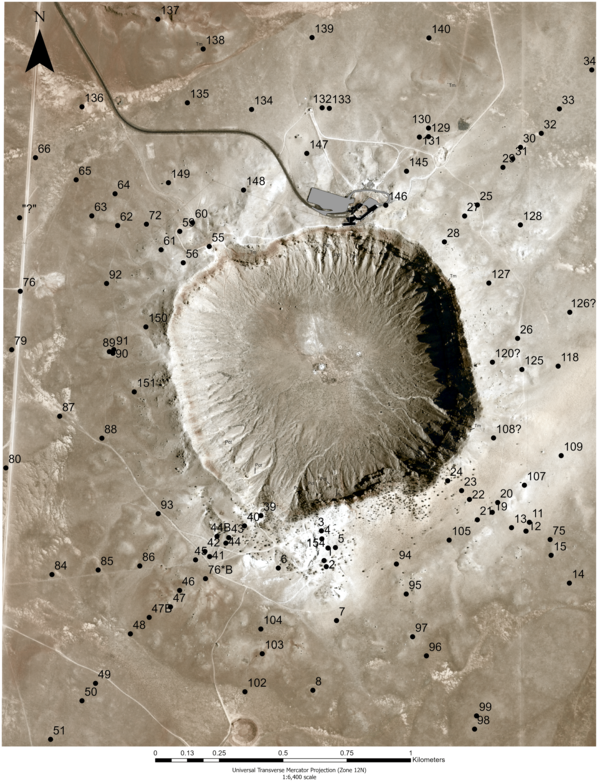
Aerial image of Meteor Crater with drill hole annotations
Aerial image of Meteor Crater with drill hole annotationsAerial image showing a plan view of Meteor Crater. Drill hole locations denoted by black dots and labeled with their respective drill hole numbers.
Aerial image of Meteor Crater with drill hole annotations
Aerial image of Meteor Crater with drill hole annotationsAerial image showing a plan view of Meteor Crater. Drill hole locations denoted by black dots and labeled with their respective drill hole numbers.

Meteor Crater drill cutting sample storage boxes
Small cardboard boxes that are used to store and archive drill cuttings from Meteor Crater.
Small cardboard boxes that are used to store and archive drill cuttings from Meteor Crater.

Meteor Crater cuttings from drill hole #22
Sample bags of cuttings from drill hole 22. Samples were collected every one foot (0.3 meters) until reaching bedrock, depths are recorded on sample bags in feet.
Sample bags of cuttings from drill hole 22. Samples were collected every one foot (0.3 meters) until reaching bedrock, depths are recorded on sample bags in feet.

Meteor Crater sample collection
The Meteor Crater sample collection contains many samples. Some are shown here in polyethylene bags or small manilla coin envelopes with rock fragments and powdered material. The collection is stored in large boxes (also shown).
The Meteor Crater sample collection contains many samples. Some are shown here in polyethylene bags or small manilla coin envelopes with rock fragments and powdered material. The collection is stored in large boxes (also shown).

Meteor Crater impact melt particles
Small fragments of dark, glassy impact melt particles from Meteor Crater, and larger, white shock-melted Coconino sandstone.
Small fragments of dark, glassy impact melt particles from Meteor Crater, and larger, white shock-melted Coconino sandstone.

USGS Flagstaff Science Campus Group Photo
This is a group photo of members of the U.S. Geological Survey Open House team from the Astrogeology Science Center; Arizona Water Science Center; Southwest Biological Science Center; Geology, Minerals, Energy, Geophysics Science Center; and Western Geographic Science Center.
This is a group photo of members of the U.S. Geological Survey Open House team from the Astrogeology Science Center; Arizona Water Science Center; Southwest Biological Science Center; Geology, Minerals, Energy, Geophysics Science Center; and Western Geographic Science Center.
A USGS cartographer discusses planetary geology with the public
A USGS cartographer discusses planetary geology with the publicUSGS cartographer Ben Wheeler discusses planetary geology with the public in the Photogrammetry Lab at the Astrogeology building on the Flagstaff USGS science campus, during an Open House.
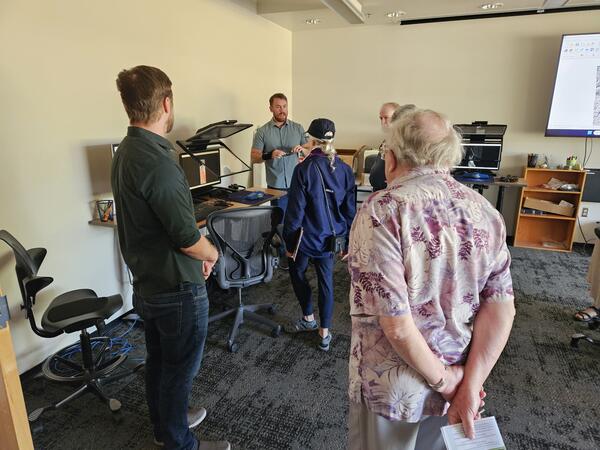
A USGS cartographer engages with the public in the Photogrammetry Lab at the Flagstaff USGS Open House
A USGS cartographer engages with the public in the Photogrammetry Lab at the Flagstaff USGS Open HouseUSGS cartographer Ben Wheeler engages with the public in the Photogrammetry Lab in the Astrogeology building at the 2024 USGS Flagstaff Open House. Photo by Lori Pigue, USGS.
A USGS cartographer engages with the public in the Photogrammetry Lab at the USGS Flagstaff Open House
A USGS cartographer engages with the public in the Photogrammetry Lab at the USGS Flagstaff Open HouseUSGS cartographer Ben Wheeler engages with the public in the Photogrammetry Lab in the Astrogeology building at the 2024 USGS Flagstaff Open House. Photo by Lori Pigue, USGS.
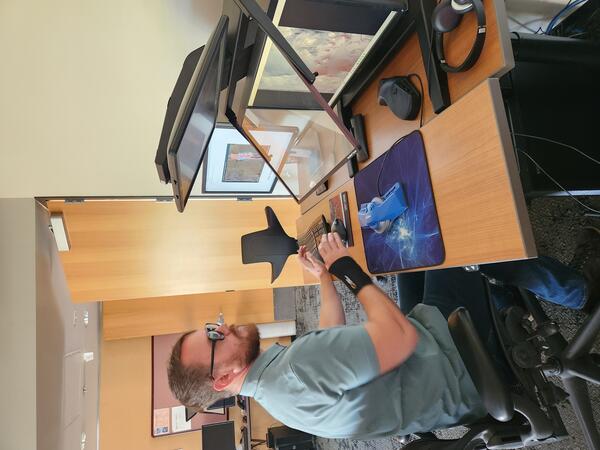
A USGS cartographer works in the Astrogeology Photogrammetry Lab
A USGS cartographer works in the Astrogeology Photogrammetry LabUSGS cartographer Ben Wheeler works in the Astrogeology Photogrammetry Lab at the USGS Flagstaff science campus.
A USGS cartographer works in the Astrogeology Photogrammetry Lab
A USGS cartographer works in the Astrogeology Photogrammetry LabUSGS cartographer Ben Wheeler works in the Astrogeology Photogrammetry Lab at the USGS Flagstaff science campus.

Using Machine Learning and Artificial Intelligence to Find Outliers in Curiosity Rover's ChemCam Data
Using Machine Learning and Artificial Intelligence to Find Outliers in Curiosity Rover's ChemCam DataOblique view of Gale crater, Mars, annotated with the Curiosity rover's traverse. Inset images show targets identified as outliers in ChemCam data using a machine learning algorithm developed by REU student Liberty Mallison.

Mars Curiosity Rover image on sol 4251
This image was taken by the NASA Mars curiosity rover on sol 4251 by the front hazcam.
This image was taken by the NASA Mars curiosity rover on sol 4251 by the front hazcam.

Example of nested mapping scales at the Apollo 17 landing site
Example of nested mapping scales at the Apollo 17 landing siteThe nested quality of USGS IMAP 800 is exemplified in this image. The inset of the 1:50K (smaller area, larger scale) landing site map is outlined on the 1:250K (larger area, smaller scale) map of the Taurus Littrow area. Photo Credit: USGS Astrogeology

Comparison of Apollo 11 and Apollo 17 traverses
The Apollo 11 Traverses (left) did not travel more than ~1/10th of a mile from the LEM. The Apollo 17 Traverses (base image), on the other hand, traveled 22.2 miles in Grover. This map illustrates the difference in scale between the two missions. Photo Credit: NASA/GFSC/ASU, USGS Astrogeology
The Apollo 11 Traverses (left) did not travel more than ~1/10th of a mile from the LEM. The Apollo 17 Traverses (base image), on the other hand, traveled 22.2 miles in Grover. This map illustrates the difference in scale between the two missions. Photo Credit: NASA/GFSC/ASU, USGS Astrogeology

Hunga Tonga Volcano Ash Plume
GOES-West image of the explosive eruption of the Hunga Tonga volcano in 2022. The explosion atmospheric pressure waves that traveled around the world. Read more here.
GOES-West image of the explosive eruption of the Hunga Tonga volcano in 2022. The explosion atmospheric pressure waves that traveled around the world. Read more here.

Lunar Reconnaissance Orbiter Camera Mosaic of Gruithuisen Domes
Lunar Reconnaissance Orbiter Camera Mosaic of Gruithuisen DomesLunar Reconnaissance Orbiter Camera (LROC) mosaic of the Gruithuisen (pronounced “groot-high-sen”) domes on the Moon. These unusual high-silica volcanic features are the target of the NASA Lunar Vulkan Imaging Spectroscopy Explorer (Lunar-VISE) mission. USGS scientist Kristen Bennett is a member of the Lunar-VISE science team.

Asteroid Impact Modeling Working Group Hikes into Meteor Crater
Asteroid Impact Modeling Working Group Hikes into Meteor CraterThis photograph shows members of the Asteroid Impact Modeling Working Group workshop participants descending into Meteor Crater in northern Arizona. Meteor Crater is the best-preserved asteroid impact crater on Earth. It has been used to study the effects of impact, and as a site to train astronauts.

USGS Astrogeology staff table at the Spring 2024 STEM event
USGS Astrogeology staff table at the Spring 2024 STEM eventUSGS Astrogeology staff table at the Spring 2024 STEM event. Photo courtesy of Lori Pigue, USGS Astrogeology.
USGS Astrogeology staff table at the Spring 2024 STEM event
USGS Astrogeology staff table at the Spring 2024 STEM eventUSGS Astrogeology staff table at the Spring 2024 STEM event. Photo courtesy of Lori Pigue, USGS Astrogeology.
Python Hyperspectral Analysis Tool (PyHAT) Logo
This a version of the logo for the Python Hyperspectral Analysis Tool (PyHAT). It is intended for use in info boxes on the USGS website. The spectrum in the graphic is a laser induced breakdown spectroscopy spectrum, plotted on a logarithmic y axis to emphasize weaker emission peaks.
This a version of the logo for the Python Hyperspectral Analysis Tool (PyHAT). It is intended for use in info boxes on the USGS website. The spectrum in the graphic is a laser induced breakdown spectroscopy spectrum, plotted on a logarithmic y axis to emphasize weaker emission peaks.
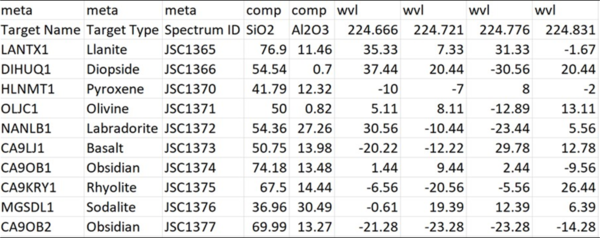
Python Hyperspectral Analysis Tool (PyHAT) Data Format Example
Python Hyperspectral Analysis Tool (PyHAT) Data Format ExampleScreenshot showing the simple data format used by the Python Hyperspectral Analysis Tool (PyHAT). Spectra are stored in rows of the table, along with their associated metadata and compositional information.