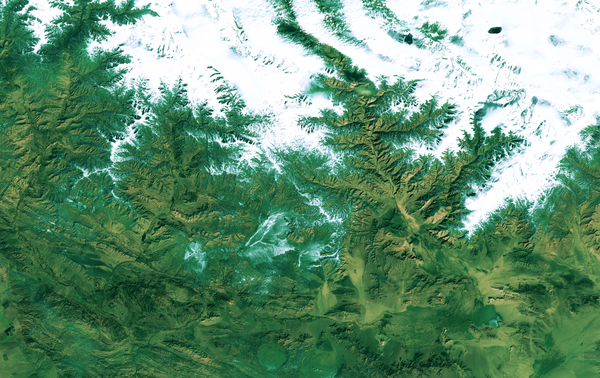
Landsat 9 image of the China-Mongolia border, showing parts of the autonomous region of Xinjiang, China, and Khovd Province, Mongolia.
Image date: October 23, 2024
Path 141, Row 28

Official websites use .gov
A .gov website belongs to an official government organization in the United States.
Secure .gov websites use HTTPS
A lock () or https:// means you’ve safely connected to the .gov website. Share sensitive information only on official, secure websites.
Peruse our selection of remote sensing and Earth science imagery below.
Landsat 9 image of the China-Mongolia border, showing parts of the autonomous region of Xinjiang, China, and Khovd Province, Mongolia.
Image date: October 23, 2024
Path 141, Row 28
Landsat 9 image of the China-Mongolia border, showing parts of the autonomous region of Xinjiang, China, and Khovd Province, Mongolia.
Image date: October 23, 2024
Path 141, Row 28

Lake Superior water body showing pixelated land cover layers over the water that should just be water.
Lake Superior water body showing pixelated land cover layers over the water that should just be water.
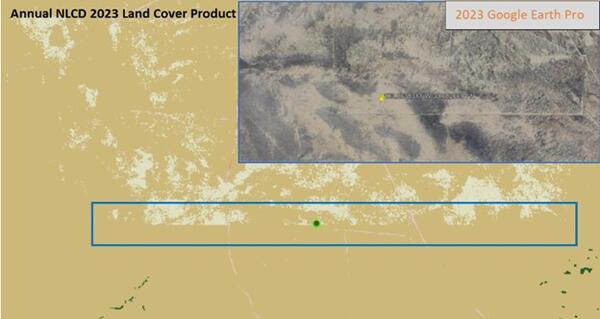
Desert in the Southwest showing “blockiness” between shrubland and grassland in Annual NLCD land cover.
Desert in the Southwest showing “blockiness” between shrubland and grassland in Annual NLCD land cover.
A graphic to be used as a general illustration of user manual to be used as in the background.
A graphic to be used as a general illustration of user manual to be used as in the background.

Annual NLCD Animation for Sioux Falls, South Dakota. Annual NLCD is a new generation of land cover mapping that offers annual land cover and land change science products nationwide with nearly four decades of data. Learn more here: https://usgs.gov/annualnlcd
Annual NLCD Animation for Sioux Falls, South Dakota. Annual NLCD is a new generation of land cover mapping that offers annual land cover and land change science products nationwide with nearly four decades of data. Learn more here: https://usgs.gov/annualnlcd
Annual NLCD Animation for Sioux Falls, South Dakota, with photo of the USGS EROS Center in the background. Annual NLCD is a new generation of land cover mapping that offers annual land cover and land change science products nationwide with nearly four decades of data. Learn more here: https://usgs.gov/annualnlcd
Annual NLCD Animation for Sioux Falls, South Dakota, with photo of the USGS EROS Center in the background. Annual NLCD is a new generation of land cover mapping that offers annual land cover and land change science products nationwide with nearly four decades of data. Learn more here: https://usgs.gov/annualnlcd

Annual NLCD is a new generation of land cover mapping that offers annual land cover and land change science products nationwide with nearly four decades of data. Learn more here: https://usgs.gov/annualnlcd
Annual NLCD is a new generation of land cover mapping that offers annual land cover and land change science products nationwide with nearly four decades of data. Learn more here: https://usgs.gov/annualnlcd

Annual NLCD is a new generation of land cover mapping that offers annual land cover and land change science products nationwide with nearly four decades of data. Learn more here: https://usgs.gov/annualnlcd
Annual NLCD is a new generation of land cover mapping that offers annual land cover and land change science products nationwide with nearly four decades of data. Learn more here: https://usgs.gov/annualnlcd
Annual NLCD is a new generation of land cover mapping that offers annual land cover and land change science products nationwide with nearly four decades of data. Learn more here: https://usgs.gov/annualnlcd
Annual NLCD is a new generation of land cover mapping that offers annual land cover and land change science products nationwide with nearly four decades of data. Learn more here: https://usgs.gov/annualnlcd

A simple "Newsletter" logo that can be utilized for social media links. Created for the Annual NLCD website.
A simple "Newsletter" logo that can be utilized for social media links. Created for the Annual NLCD website.

LANDFIRE partner logos: Department of the Interior (DOI), Department of Agriculture (USDA), U.S. Geological Survey (USGS), U.S. Forest Service (USFS), and The Nature Conservancy
LANDFIRE partner logos: Department of the Interior (DOI), Department of Agriculture (USDA), U.S. Geological Survey (USGS), U.S. Forest Service (USFS), and The Nature Conservancy
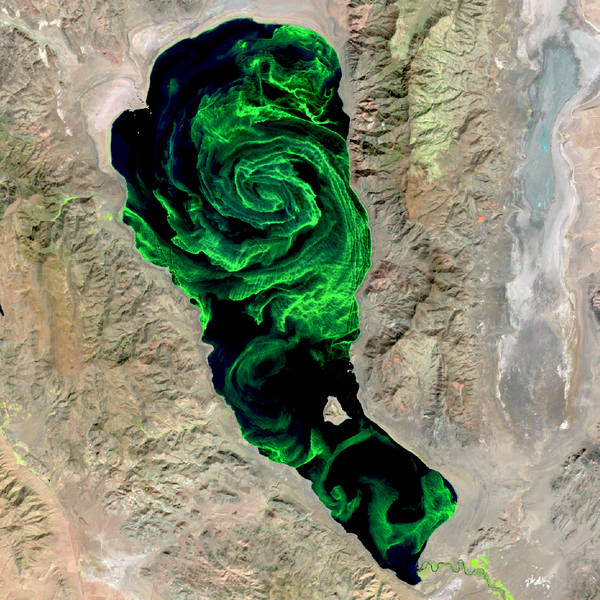
Pyramid Lake is one of the largest natural lakes in the state of Nevada, covering an area of about 188 square miles (487 square kilometers). Located entirely within the Pyramid Lake Paiute Tribe Reservation on the western margin of the Great Basin Desert, this deep terminal lake is widely regarded as a world class fishery.
Pyramid Lake is one of the largest natural lakes in the state of Nevada, covering an area of about 188 square miles (487 square kilometers). Located entirely within the Pyramid Lake Paiute Tribe Reservation on the western margin of the Great Basin Desert, this deep terminal lake is widely regarded as a world class fishery.

Las Vegas, Nevada and the area surrounding has been and remains a popular region of interest when showcasing urban growth and land change using Landsat sensors.
Las Vegas, Nevada and the area surrounding has been and remains a popular region of interest when showcasing urban growth and land change using Landsat sensors.

A September 20, 2024, Landsat 9 satellite image of eutrophication in Lake Thompson, South Dakota. Eutrophication because of phosphate fertilizer use is probably one of the most notable impacts on the environment, society and the economy.
A September 20, 2024, Landsat 9 satellite image of eutrophication in Lake Thompson, South Dakota. Eutrophication because of phosphate fertilizer use is probably one of the most notable impacts on the environment, society and the economy.

The Multi-Resolution Land Characteristics (MRLC) Consortium has several different ways to access data, including a web-visualization tool. Users have the ability of several different download methods on the viewer: drawing a rectangle, drawing a polygon, entering GeoJSON information, and uploading a shapefile.
The Multi-Resolution Land Characteristics (MRLC) Consortium has several different ways to access data, including a web-visualization tool. Users have the ability of several different download methods on the viewer: drawing a rectangle, drawing a polygon, entering GeoJSON information, and uploading a shapefile.

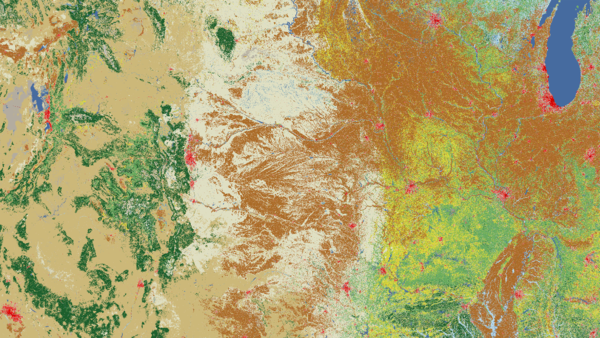
A zoomed in image of Annual NLCD Land Cover in 2023 for Silverdale, Washington. Annual NLCD Land Cover science product represents the most likely thematic land cover type of the Anderson Level II classes. Learn more about Annual NLCD.
A zoomed in image of Annual NLCD Land Cover in 2023 for Silverdale, Washington. Annual NLCD Land Cover science product represents the most likely thematic land cover type of the Anderson Level II classes. Learn more about Annual NLCD.

Annual NLCD science products are available for download on the U.S Geological Survey (USGS repository. All six science products from 1985-2023 for the conterminous United States).
Annual NLCD science products are available for download on the U.S Geological Survey (USGS repository. All six science products from 1985-2023 for the conterminous United States).

Zoomed in image of Annual NLCD Land Cover in 1985. Annual NLCD Land Cover science product represents the most likely thematic land cover type of the Anderson Level II classes.
Zoomed in image of Annual NLCD Land Cover in 1985. Annual NLCD Land Cover science product represents the most likely thematic land cover type of the Anderson Level II classes.

The Multi-Resolution Land Characteristics (MRLC) consortium hosts land cover and land condition data from various sources, including Annual NLCD. Annual NLCD science products are found under the projects tab, and user have the ability to download Annual NLCD CONUS mosaics from 1985-2023.
The Multi-Resolution Land Characteristics (MRLC) consortium hosts land cover and land condition data from various sources, including Annual NLCD. Annual NLCD science products are found under the projects tab, and user have the ability to download Annual NLCD CONUS mosaics from 1985-2023.

The Multi-Resolution Land Characteristics (MRLC) Consortium provides users with the Enhanced Visualization and Analysis (EVA) tool, which allows users to interact with Annual NLCD science products at the county level between two different dates. The EVA tool creates landcover analysis and the user has the ability to generate a more detailed report.
The Multi-Resolution Land Characteristics (MRLC) Consortium provides users with the Enhanced Visualization and Analysis (EVA) tool, which allows users to interact with Annual NLCD science products at the county level between two different dates. The EVA tool creates landcover analysis and the user has the ability to generate a more detailed report.

The TimeSync tool is used to record attribute information for each plot. On the interface, the drop in NDVI values is noticeable. When you look at the Landsat images 1994 and 1995, there is a clear difference between the two images.
The TimeSync tool is used to record attribute information for each plot. On the interface, the drop in NDVI values is noticeable. When you look at the Landsat images 1994 and 1995, there is a clear difference between the two images.