
Annual National Land Cover Database (NLCD) map of the United States with classifications for types of land cover. Produced by the USGS Earth Resources Observation and Science (EROS) Center.
Images
Peruse our selection of remote sensing and Earth science imagery below.
Filter Total Items: 871
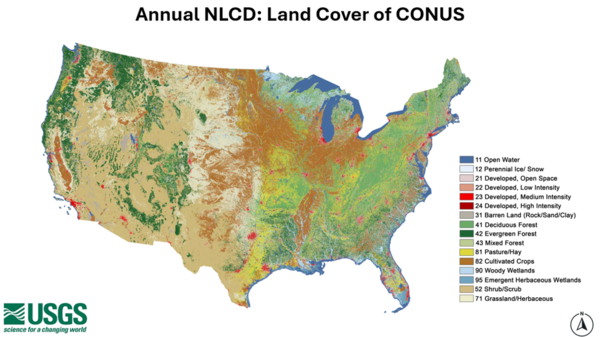
Annual NLCD map of the United States with legend
Annual National Land Cover Database (NLCD) map of the United States with classifications for types of land cover. Produced by the USGS Earth Resources Observation and Science (EROS) Center.
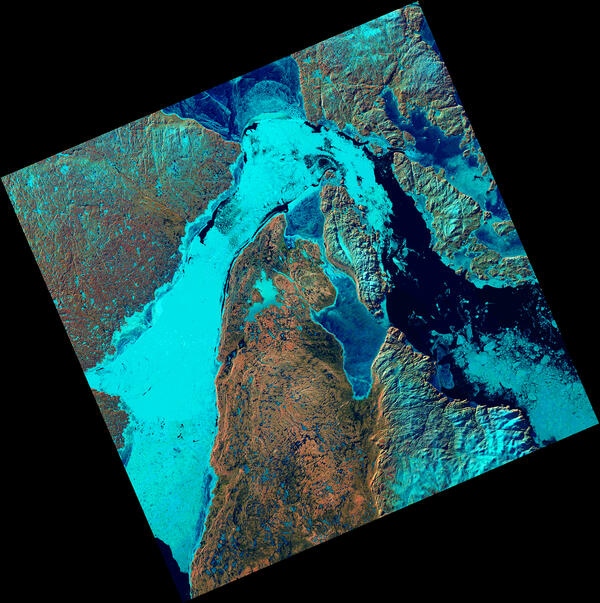
Ice Fills Roes Welcome Sound
The Landsat 8 satellite captured an image showing sea ice packed into Roes Welcome Sound, located along the northwestern edge of Southampton Island and around Qikiqtaaluk Island in the uninhabited Canadian Arctic Archipelago. East of Qikiqtaaluk, ice drifts through the Frozen Strait, extending eastward into Foxe Basin.
The Landsat 8 satellite captured an image showing sea ice packed into Roes Welcome Sound, located along the northwestern edge of Southampton Island and around Qikiqtaaluk Island in the uninhabited Canadian Arctic Archipelago. East of Qikiqtaaluk, ice drifts through the Frozen Strait, extending eastward into Foxe Basin.
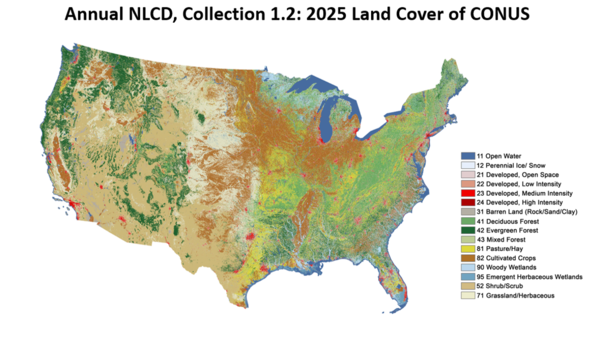
Annual National Land Cover Database (NLCD) Collection 1.2 map
Annual National Land Cover Database (NLCD) Collection 1.2 mapAnnual National Land Cover Database (NLCD) Collection 1.2 map of 2025 data, produced at USGS Earth Resources Observation and Science (EROS) Center based on Landsat satellite data.
Cumulative Number of Landsat Scenes
The USGS Landsat archive holds over fifty years of Earth-Observing satellite data. This animation displays the cumulative number of Landsat scenes since 1972. The colors on the maps show the density of the number of Landsat Level-1 products.
The USGS Landsat archive holds over fifty years of Earth-Observing satellite data. This animation displays the cumulative number of Landsat scenes since 1972. The colors on the maps show the density of the number of Landsat Level-1 products.
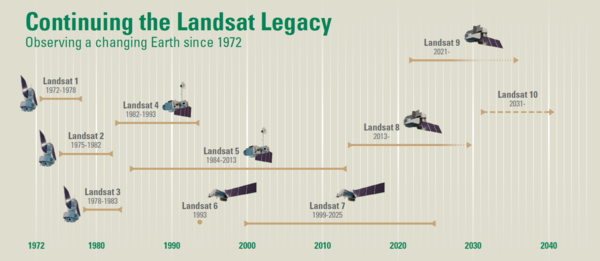
Continuing the Landsat Legacy
Timeline of the Landsat program, beginning with the launch of Landsat 1 in 1972. Landsat 10 is expected to launch in 2031. As the tenth Landsat mission, it will continue the legacy of the Landsat program.
Visit the Landsat Missions webpage to learn more.
Timeline of the Landsat program, beginning with the launch of Landsat 1 in 1972. Landsat 10 is expected to launch in 2031. As the tenth Landsat mission, it will continue the legacy of the Landsat program.
Visit the Landsat Missions webpage to learn more.
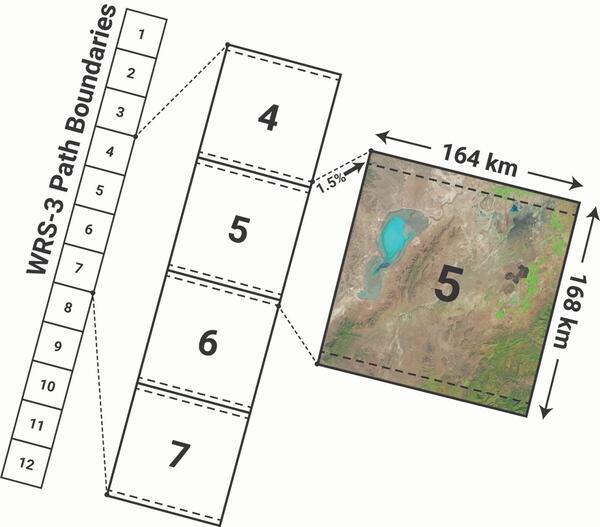
Worldwide Reference System-3 (WRS-3)
A new Worldwide Reference System, WRS-3, was developed for Landsat 10 due to the change in orbital parameters. The WRS-3 will provide a method to acquire, index, and catalog Landsat 10 scenes.
A new Worldwide Reference System, WRS-3, was developed for Landsat 10 due to the change in orbital parameters. The WRS-3 will provide a method to acquire, index, and catalog Landsat 10 scenes.
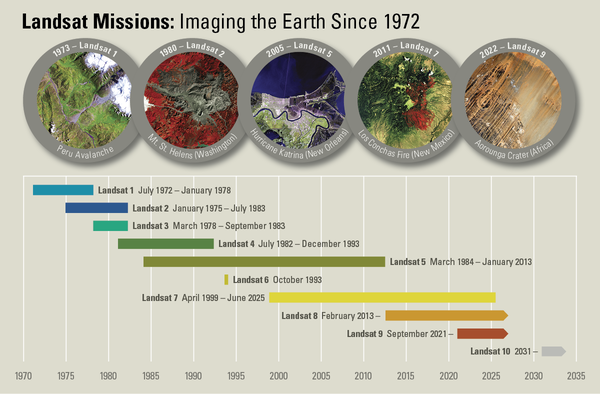
Landsat Missions Timeline
In a September 21, 1966 press release, Secretary of the Interior Stewart Udall announced that the DOI was launching "Project EROS (Earth Resources Observation Satellites)." Udall's vision was to observe the Earth for the benefit of all.
In a September 21, 1966 press release, Secretary of the Interior Stewart Udall announced that the DOI was launching "Project EROS (Earth Resources Observation Satellites)." Udall's vision was to observe the Earth for the benefit of all.
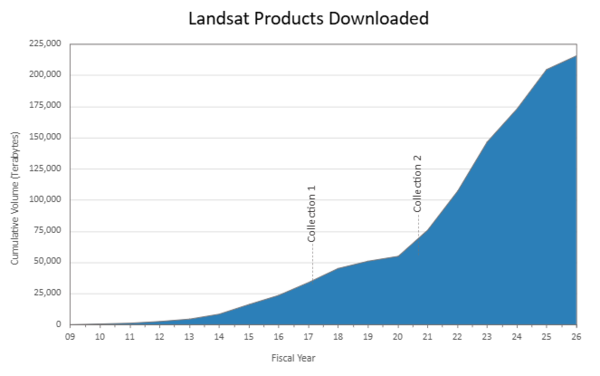
Landsat Product Downloads by Volume
This graphic displays the cumulative volume of all operational Landsat products downloaded from the USGS EROS Landsat archive since December 2008 (FY2009). The release of Landsat Collection 2 products in 2020, which improved data quality and accessibility, helped drive downloads upward.
This graphic displays the cumulative volume of all operational Landsat products downloaded from the USGS EROS Landsat archive since December 2008 (FY2009). The release of Landsat Collection 2 products in 2020, which improved data quality and accessibility, helped drive downloads upward.
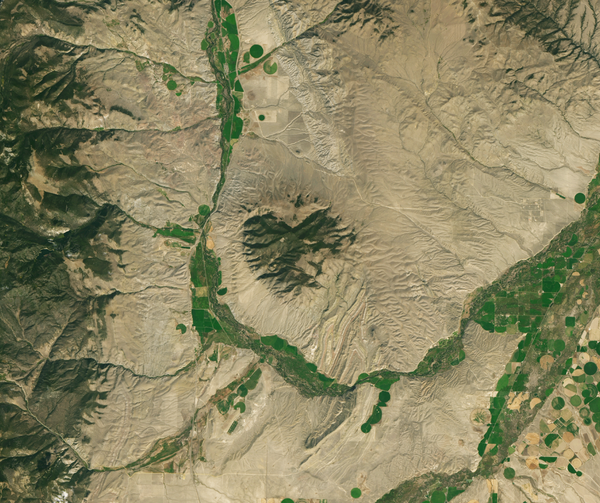
Landsat 9 Image of McCartney Mountain
Landsat 9 captured this image of heart-shaped McCartney Mountain on September 20, 2025. At an elevation of over 8,300 feet, the mountain is the high point of a small sub-range of the Highland Mountains in southwestern Montana.
Landsat 9 captured this image of heart-shaped McCartney Mountain on September 20, 2025. At an elevation of over 8,300 feet, the mountain is the high point of a small sub-range of the Highland Mountains in southwestern Montana.
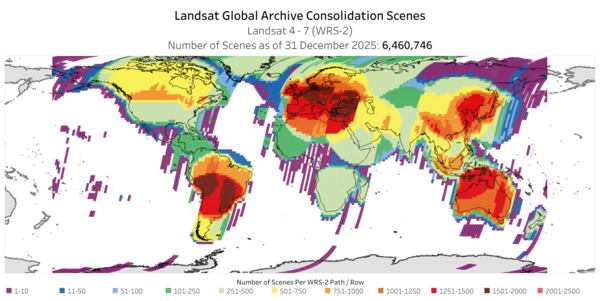
Landsat Global Archive Consolidation WRS 2 Scenes
This map displays the scenes acquired by Landsat 4, Landsat 5, and Landsat 7 satellites, on the World Reference System (WRS-2). These scenes were initially downlinked and stored at Landsat International Cooperator Ground Stations.
This map displays the scenes acquired by Landsat 4, Landsat 5, and Landsat 7 satellites, on the World Reference System (WRS-2). These scenes were initially downlinked and stored at Landsat International Cooperator Ground Stations.
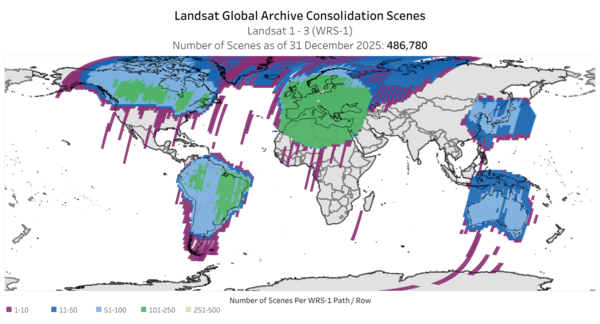
Landsat Global Archive Consolidation WRS 1 Scenes
This map displays the scenes acquired by Landsat 1, Landsat 2, and Landsat 3 satellites, on the World Reference System (WRS-1). These scenes were initially downlinked and stored at Landsat International Cooperator Ground Stations.
This map displays the scenes acquired by Landsat 1, Landsat 2, and Landsat 3 satellites, on the World Reference System (WRS-1). These scenes were initially downlinked and stored at Landsat International Cooperator Ground Stations.

The EROS User Experience Webinar Series graphic
The USGS EROS User Experience Webinar graphic.
Visit the webinar series webpage to learn more
The USGS EROS User Experience Webinar graphic.
Visit the webinar series webpage to learn more
EROS User Experience Webinar Series Banner
This image represents the topics discussed in the EROS User Experience Webinar Series.
Visit the webpage: https://www.usgs.gov/centers/eros/eros-user-experience-webinars.
This image represents the topics discussed in the EROS User Experience Webinar Series.
Visit the webpage: https://www.usgs.gov/centers/eros/eros-user-experience-webinars.
Landsat and Annual NLCD animations of the Powder River Basin area from 1985 to 2024
Landsat and Annual NLCD animations of the Powder River Basin area from 1985 to 2024Landsat and Annual NLCD animations of the Powder River Basin area in eastern Wyoming from 1985 to 2024 show areas where mining has begun and has shifted over time.
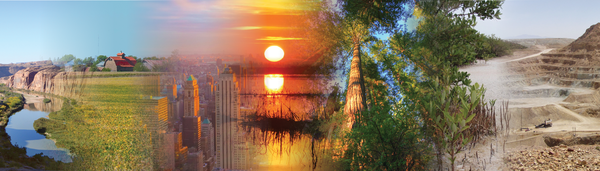
Landsat Benefits Webpage Banner
The Landsat Benefits Webpage Banner displays some ways of how Landsat data benefits the United States.
Visit the Landsat Benefits, State by State webpage to see how Landsat benefits your favorite State!
The Landsat Benefits Webpage Banner displays some ways of how Landsat data benefits the United States.
Visit the Landsat Benefits, State by State webpage to see how Landsat benefits your favorite State!
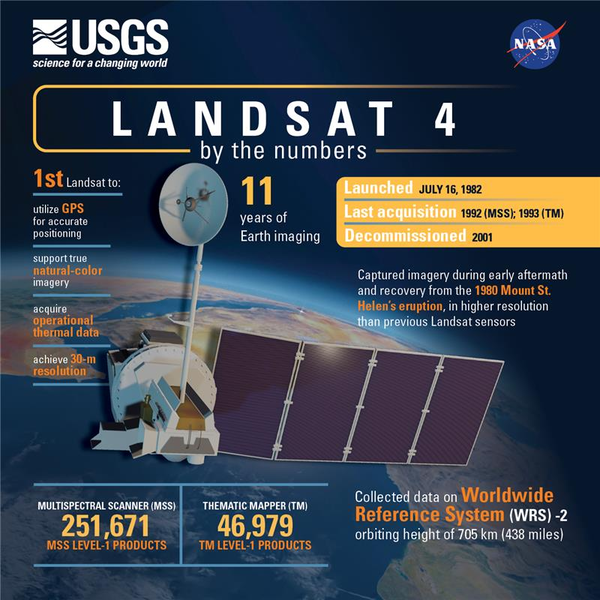
Landsat 4 Mission Infographic
The Landsat 4 satellite was launched July 16, 1982, and ushered in many “firsts” that propelled the Landsat missions that followed.
The Landsat 4 satellite was launched July 16, 1982, and ushered in many “firsts” that propelled the Landsat missions that followed.
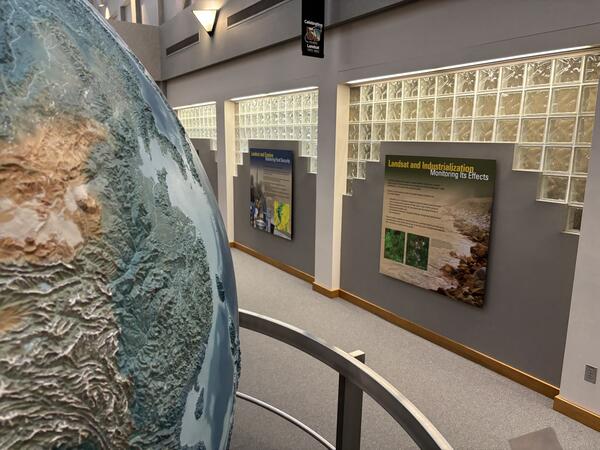
A portion of the atrium at the USGS Earth Resources Observation and Science (EROS) Center
A portion of the atrium at the USGS Earth Resources Observation and Science (EROS) CenterA portion of the atrium at the USGS Earth Resources Observation and Science (EROS) Center, including the large revolving globe and science displays about Landsat satellites in the background. USGS photo
Apalachicola River Watershed and Bay
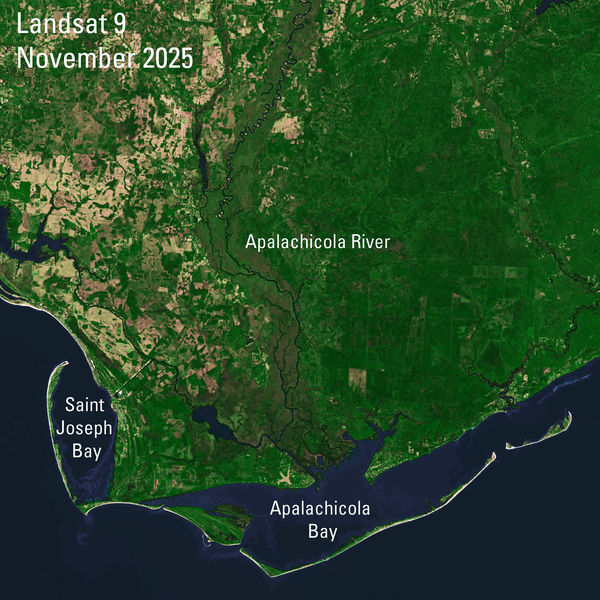
This Landsat 9 image shows the Apalachicola River and the Apalachicola Bay in Florida’s Panhandle. The river —Florida’s largest in terms of water volume discharge— follows the western boundary of heavy forest and is home to great diversity of freshwater fish species.
This Landsat 9 image shows the Apalachicola River and the Apalachicola Bay in Florida’s Panhandle. The river —Florida’s largest in terms of water volume discharge— follows the western boundary of heavy forest and is home to great diversity of freshwater fish species.
Landsat Sees Where the Snow Lands
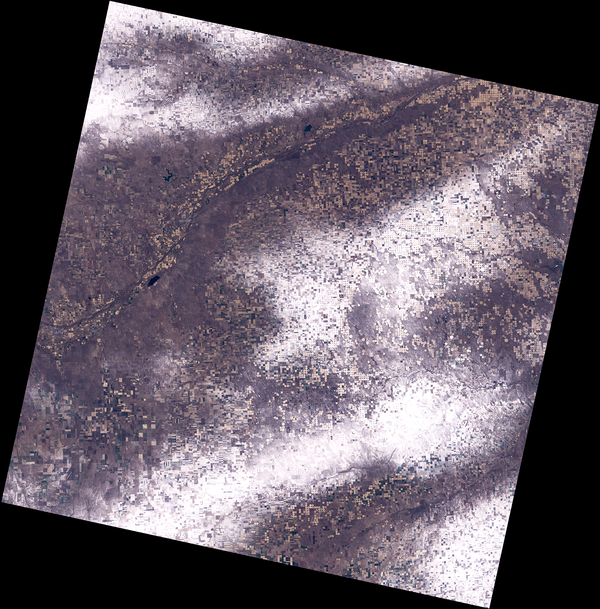
November’s final weekend brought snowfall to much of the northern United States. This Landsat 9 image, acquired on December 1st, highlights an area along the South Platte River near the point where the Missouri, Nebraska, and Colorado borders meet.
November’s final weekend brought snowfall to much of the northern United States. This Landsat 9 image, acquired on December 1st, highlights an area along the South Platte River near the point where the Missouri, Nebraska, and Colorado borders meet.
Annual NLCD showing growth in urban areas across the United States
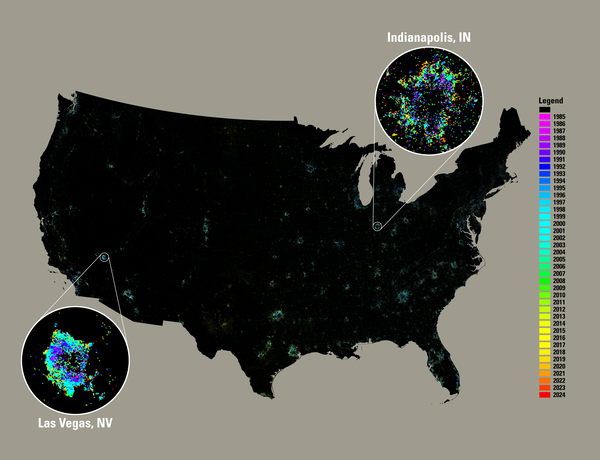
Annual NLCD showing growth in urban areas across the United StatesThis map, produced with Annual National Land Cover Database (NLCD) Collection 1.1 data from 1985 to 2024, shows the growth in urban areas (development) across the United States. Various colors represent the year that new growth occurred in a particular spot.
Annual NLCD showing growth in urban areas across the United States
Annual NLCD showing growth in urban areas across the United StatesThis map, produced with Annual National Land Cover Database (NLCD) Collection 1.1 data from 1985 to 2024, shows the growth in urban areas (development) across the United States. Various colors represent the year that new growth occurred in a particular spot.