U.S. flag

An official website of the United States government

Images

Geologic Hazards Science Center images.

Filter Total Items: 286
USGS Rob Anthony sets up equipment in a freezer to test a Seismometer.
Testing the Deep Ice Seismometer

USGS Rob Anthony sets up equipment in a freezer to test a Seismometer Interface Module at the Physical Sciences Laboratory in Stoughton, Wisconsin on Aug. 7, 2025. (Photo by Taylor Wolfram / UW–Madison)

USGS Rob Anthony sets up equipment in a freezer to test a Seismometer Interface Module at the Physical Sciences Laboratory in Stoughton, Wisconsin on Aug. 7, 2025. (Photo by Taylor Wolfram / UW–Madison)

A photo of the seismometer being assembled.
IceCube 2025-08-07TW 0578

USGS Rob Anthony puts in the Seismometer Interface Module while assembling a seismometer at the Physical Sciences Laboratory in Stoughton, Wisconsin on Aug. 7, 2025. (Photo by Taylor Wolfram / UW–Madison)

USGS Rob Anthony puts in the Seismometer Interface Module while assembling a seismometer at the Physical Sciences Laboratory in Stoughton, Wisconsin on Aug. 7, 2025. (Photo by Taylor Wolfram / UW–Madison)

A group assembling a seismometer at the Physical Sciences Laboratory.
IceCube 2025-08-07TW 1279

Nicholas Pelyk, Jason Patton, Rob Anthony, and Skyler Grulke slide a part into the tube while assembling a seismometer at the Physical Sciences Laboratory in Stoughton, Wisconsin on Aug. 7, 2025. (Photo by Taylor Wolfram / UW–Madison)

Nicholas Pelyk, Jason Patton, Rob Anthony, and Skyler Grulke slide a part into the tube while assembling a seismometer at the Physical Sciences Laboratory in Stoughton, Wisconsin on Aug. 7, 2025. (Photo by Taylor Wolfram / UW–Madison)

Assembling a seismometer at the Physical Sciences Laboratory in Stoughton.
IceCube 2025-08-07TW 0407

Jason Patton, Rob Anthony (USGS), and Skyler Grulke assemble a seismometer at the Physical Sciences Laboratory in Stoughton, Wisconsin on Aug. 7, 2025. (Photo by Taylor Wolfram / UW–Madison)

Jason Patton, Rob Anthony (USGS), and Skyler Grulke assemble a seismometer at the Physical Sciences Laboratory in Stoughton, Wisconsin on Aug. 7, 2025. (Photo by Taylor Wolfram / UW–Madison)

Map of the United States and its territories showing the distribution of average annualized earthquake losses by region (modified from Jaiswal and others, 2023). Economic losses from earthquakes in these nine regions are estimated to average $14.7 billion dollars per year.
cir1555_fig04.png
cir1555_fig04.png
cir1555_fig04.png

Map of the United States and its territories showing the distribution of average annualized earthquake losses by region (modified from Jaiswal and others, 2023). Economic losses from earthquakes in these nine regions are estimated to average \$14.7 billion dollars per year.

Map of the United States and its territories showing the distribution of average annualized earthquake losses by region (modified from Jaiswal and others, 2023). Economic losses from earthquakes in these nine regions are estimated to average \$14.7 billion dollars per year.

Map of the United States and its territories showing 2024 International Building Code Seismic Design Categories and Risk Categories.
cir1555_fig02.png
cir1555_fig02.png
cir1555_fig02.png

Map of the United States and its territories showing 2024 International Building Code Seismic Design Categories and Risk Categories.

Map of the United States and its territories showing 2024 International Building Code Seismic Design Categories and Risk Categories.

An example of Bayesian updating of productivity parameter (a-value) for the 2010 Mw 8.8 Maule, Chile, earthquake. Immediately following the earthquake, the SZ-GENERIC region-specific a-value distribution can be used. As the aftershock sequence progresses and additional data are collected, this distribution can be treated as a prior distribution and updated using Bayes’ rule. Posterior distributions at subsequent time intervals are shown. Figure from Page et al. (2016).
AftershockForecastfig6.gif

An example of Bayesian updating of productivity parameter (a-value) for the 2010 Mw 8.8 Maule, Chile, earthquake. Immediately following the earthquake, the SZ-GENERIC region-specific a-value distribution can be used.

An example of Bayesian updating of productivity parameter (a-value) for the 2010 Mw 8.8 Maule, Chile, earthquake. Immediately following the earthquake, the SZ-GENERIC region-specific a-value distribution can be used.

Screenshot of the Aftershock Forecast for an earthquake in California, showing the information box at the top of the forecast and the four tabs of forecast information.
Mendocino_headerinfo-2.jpg

Screenshot of the Aftershock Forecast for an earthquake in California, showing the information box at the top of the forecast and the four tabs of forecast information.

Screenshot of the Aftershock Forecast for an earthquake in California, showing the information box at the top of the forecast and the four tabs of forecast information.

Aftershock Forecast Sequence-Specific Model Parameters
AftershockForecastSequence-SpecificModelParameters.png

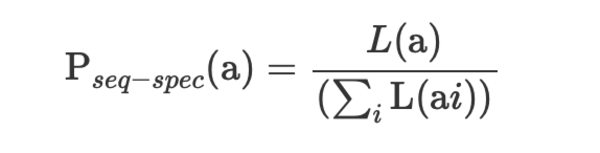
Aftershock Forecast Sequence-Specific Model Parameters equation 

The probability distribution for the number of aftershocks, P(N), and the forecast can then be computed using the same procedures as for the generic model, using Pseq-spec(a) instead of Pgeneric(a).

Aftershock Forecast Sequence-Specific Model Parameters equation 

The probability distribution for the number of aftershocks, P(N), and the forecast can then be computed using the same procedures as for the generic model, using Pseq-spec(a) instead of Pgeneric(a).

Screenshot of the Aftershock Forecast for an earthquake in California, with the “Summary” tab selected, and “M4+” and “Show All” selections for magnitude and forecast duration.
Mendocino_M41month.jpg

Screenshot of the Aftershock Forecast for an earthquake in California, with the “Summary” tab selected, and “M4+” and “Show All” selections for magnitude and forecast duration.

Screenshot of the Aftershock Forecast for an earthquake in California, with the “Summary” tab selected, and “M4+” and “Show All” selections for magnitude and forecast duration.

Screenshot of the Aftershock Forecast for an earthquake in California, with the “Summary” tab selected, and “M4+” and “Show All” selections for magnitude and forecast duration.
Mendocino_M4all.jpg
Mendocino_M4all.jpg
Mendocino_M4all.jpg

Screenshot of the Aftershock Forecast for an earthquake in California, with the “Summary” tab selected, and “M4+” and “Show All” selections for magnitude and forecast duration.
 

Screenshot of the Aftershock Forecast for an earthquake in California, with the “Summary” tab selected, and “M4+” and “Show All” selections for magnitude and forecast duration.
 

Screenshot of the Aftershock Forecast for an earthquake in California, with the “Forecast Table” tab selected.
Mendocino_table.jpg
Mendocino_table.jpg
Mendocino_table.jpg

Screenshot of the Aftershock Forecast for an earthquake in California, with the “Forecast Table” tab selected.

Screenshot of the Aftershock Forecast for an earthquake in California, with the “Forecast Table” tab selected.

Screenshot of the Overview webpage for an earthquake in California. The “Aftershock Forecast” card is at lower center.
Aftershock Forecast on the earthquake event page

Screenshot of the Overview webpage for an earthquake in California. The “Aftershock Forecast” card is at lower center.

Screenshot of the Aftershock Forecast for an earthquake in California, with the “Summary” tab selected, and “Show All” and “1
Aftershock Forecast for an earthquake in California

Screenshot of the Aftershock Forecast for an earthquake in California, with the “Summary” tab selected, and “Show All” and “1 Month” selections for magnitude and forecast duration.

Screenshot of the Aftershock Forecast for an earthquake in California, with the “Summary” tab selected, and “Show All” and “1 Month” selections for magnitude and forecast duration.

postfire debris flow science infographic
Postfire Debris Flow Science Infographic

POSTFIRE DEBRIS FLOW SCIENCE

The U.S. Geological Survey helps local, state, and federal agencies assess debris flow hazards in recently burned areas. We provide information about the likelihood of debris flow activity, where they might happen, and how big they might be.


DEBRIS FLOW ASSESSMENTS

POSTFIRE DEBRIS FLOW SCIENCE

The U.S. Geological Survey helps local, state, and federal agencies assess debris flow hazards in recently burned areas. We provide information about the likelihood of debris flow activity, where they might happen, and how big they might be.


DEBRIS FLOW ASSESSMENTS

landslide safety infographic
Landslide Safety
Landslide Safety
Landslide Safety

LANDSLIDE SAFETY

If your home or property was damaged by a landslide from Hurricane Helene, be aware of the warning signs of future landslide activity


WATCH FOR WARNING SIGNS

Signs a landslide may be moving include:

LANDSLIDE SAFETY

If your home or property was damaged by a landslide from Hurricane Helene, be aware of the warning signs of future landslide activity


WATCH FOR WARNING SIGNS

Signs a landslide may be moving include:

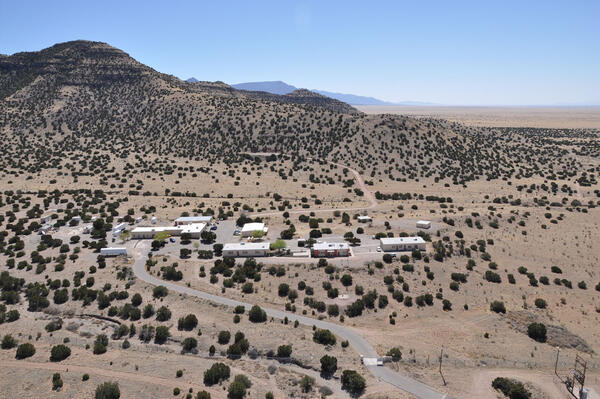
aerial view of desert with a group of buildings and mountains in the background
Aerial View of the Albuquerque Seismological Laboratory

Arial view from the North of the Albuquerque Seismological Laboratory on the Kirtland Air Force Base about 15 miles southeast of Albuquerque, New Mexico.

4 photos of seismic instruments in a barren room
Seismographs at the Albuquerque Seismological Laboratory

(a) Photograph of instruments being tested in the East portion of the underground vault. (b) Wench and location of three boreholes in the West portion of the underground vault. (c) Cross-tunnel and recording equipment for the reference sensor vault.

(a) Photograph of instruments being tested in the East portion of the underground vault. (b) Wench and location of three boreholes in the West portion of the underground vault. (c) Cross-tunnel and recording equipment for the reference sensor vault.

globe with red and green dots
Global Seismographic Network (GSN) Stations

Locations of the Global Seismographic Network (GSN) stations. USGS GSN sites are shown as pink circles and IRIS/IDA stations are shown as green circles. (as of October 2024)

Locations of the Global Seismographic Network (GSN) stations. USGS GSN sites are shown as pink circles and IRIS/IDA stations are shown as green circles. (as of October 2024)

Aerial view of landslide amongst green trees
Damage caused by a large mudflow in Buck Creek near Marion, NC. - 10/17/2024

Coordinates of photographer: Latitude: 35° 44’ 16.08” N Longitude: 82° 8’ 20.04” W

Date: 10/17/24

Caption: Damage caused by a large mudflow in Buck Creek near Marion, NC.

Taken during Hurricane Helene LASER response

Was this page helpful?