



Completed landslide monitoring station at Ponce, Puerto Rico among the palms. One of the sites in the Puerto Rico Landslide Monitoring Network.
Images
Geologic Hazards Science Center images.
Filter Total Items: 280

Ponce, Puerto Rico Landslide Monitoring Station
Completed landslide monitoring station at Ponce, Puerto Rico among the palms. One of the sites in the Puerto Rico Landslide Monitoring Network.
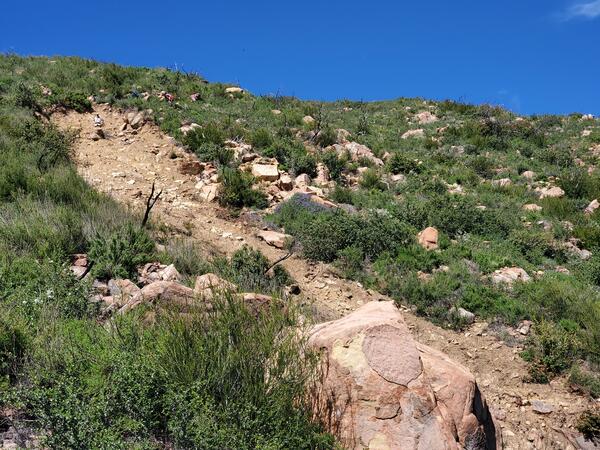
Landslide within the footprint of the 2019 Cave Fire.
Landslide within the footprint of the 2019 Cave Fire.Example of a landslide that initiated within the footprint of the 2019 Cave Fire during the 9 January 2023 rainstorm. The landslide source area is shown in the upper left of this image. The debris-flow runout path is shown in the center and lower right of this image.
Landslide within the footprint of the 2019 Cave Fire.
Landslide within the footprint of the 2019 Cave Fire.Example of a landslide that initiated within the footprint of the 2019 Cave Fire during the 9 January 2023 rainstorm. The landslide source area is shown in the upper left of this image. The debris-flow runout path is shown in the center and lower right of this image.

Hunga Tonga 2.JPG
The large HTHH volcanic explosion created fast low-frequency pressure waves that penetrated about 3.1 miles/5 kilometers into the shallow crust (shown in yellow). Wind and small explosions (shown in blue) create shorter pressure waves that only penetrate down about 328 feet/100 meters.
The large HTHH volcanic explosion created fast low-frequency pressure waves that penetrated about 3.1 miles/5 kilometers into the shallow crust (shown in yellow). Wind and small explosions (shown in blue) create shorter pressure waves that only penetrate down about 328 feet/100 meters.

Hunga Tonga 3.JPG
The waveforms of the ground motion recording and the pressure sensor recording from a station with both types of instruments (see second image above) match up, indicating that the pressure waves are causing the ground (crust) to deflect.
The waveforms of the ground motion recording and the pressure sensor recording from a station with both types of instruments (see second image above) match up, indicating that the pressure waves are causing the ground (crust) to deflect.

Debris-flow deposits downstream of the 2022 Pipeline Fire burn scar, north of Flagstaff, Arizona
Debris-flow deposits downstream of the 2022 Pipeline Fire burn scar, north of Flagstaff, ArizonaDebris-flow deposits downstream of the 2022 Pipeline Fire burn scar, north of Flagstaff, Arizona.
Debris-flow deposits downstream of the 2022 Pipeline Fire burn scar, north of Flagstaff, Arizona
Debris-flow deposits downstream of the 2022 Pipeline Fire burn scar, north of Flagstaff, ArizonaDebris-flow deposits downstream of the 2022 Pipeline Fire burn scar, north of Flagstaff, Arizona.

Chaos Canyon landslide deposits
The June 28, 2022, Chaos Canyon debris slide with main features labeled. Horizontal distance from the middle of headscarp to the middle of toe is about 585 m. North is towards the right side of the photograph.
The June 28, 2022, Chaos Canyon debris slide with main features labeled. Horizontal distance from the middle of headscarp to the middle of toe is about 585 m. North is towards the right side of the photograph.
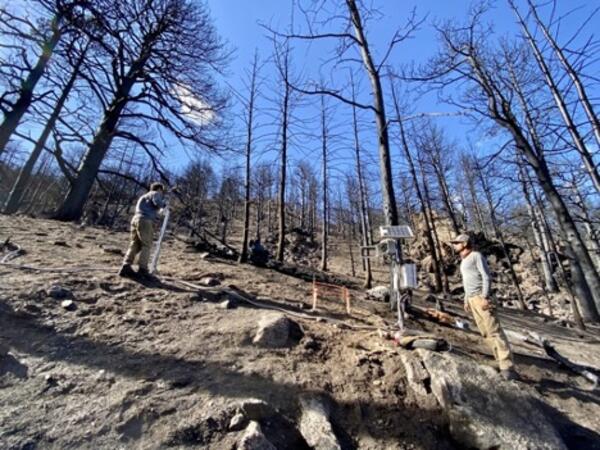
Calwood.jpg
The USGS “Heil Ranch” site is located in the Arapahoe-Roosevelt National Forest in Colorado. The site consists of instrumentation monitoring the rainfall and soil moisture.
The USGS “Heil Ranch” site is located in the Arapahoe-Roosevelt National Forest in Colorado. The site consists of instrumentation monitoring the rainfall and soil moisture.

Accelerograph
Photo of a Kinemetrics FBA-23 accelerograph. The device is black and square with rounded edges on a green background.
Photo of a Kinemetrics FBA-23 accelerograph. The device is black and square with rounded edges on a green background.

Amplification Map of Los Angeles
This image of the Los Angeles region combines this information to predict the total amplification expected in future earthquakes from local geologic conditions or site effects.
This image of the Los Angeles region combines this information to predict the total amplification expected in future earthquakes from local geologic conditions or site effects.

Volcanic Arc Diagram
A diagram depicting the tectonic components of a volcanic arc, including the back arc spreading center, back arc convection cell, zone of fractional melting, outer arc trough, outer arc ridge, subducting oceanic lithosphere, and asthenosphere.
A diagram depicting the tectonic components of a volcanic arc, including the back arc spreading center, back arc convection cell, zone of fractional melting, outer arc trough, outer arc ridge, subducting oceanic lithosphere, and asthenosphere.

Asperity
An illustration depicting an asperity (pink blob) on fault surface (yellow parallelogram).
An illustration depicting an asperity (pink blob) on fault surface (yellow parallelogram).

Asthenosphere
A diagram showing a slice of the Earth's lithosphere, including continental crust, oceanic crust, asthenosphere, and the upper mantle.
A diagram showing a slice of the Earth's lithosphere, including continental crust, oceanic crust, asthenosphere, and the upper mantle.

Basement
An illustration showing two stick figures doing basement excavations, one with a frown that excavated into the labelled hard, stable bedrock on the left and the other with a smile that excavated above the labelled bedrock surface.
An illustration showing two stick figures doing basement excavations, one with a frown that excavated into the labelled hard, stable bedrock on the left and the other with a smile that excavated above the labelled bedrock surface.

Benioff Zone
Cross-section of the Benioff zone resulting from a by the interaction of a downgoing oceanic crustal plate with a continental plate.
Cross-section of the Benioff zone resulting from a by the interaction of a downgoing oceanic crustal plate with a continental plate.

Brittle-Ductile Boundary
A sketch of the thinner crust and thicker mantle. The crust and top portion of the mantle are labelled "Lithosphere "strong'" and the bottom portion of the mantle (bottom) labelled "Asthenosphere "weak.'"
A sketch of the thinner crust and thicker mantle. The crust and top portion of the mantle are labelled "Lithosphere "strong'" and the bottom portion of the mantle (bottom) labelled "Asthenosphere "weak.'"

Carbon 14 Dating
A diagram with 3 yellow squares with arrows pointing to indicate steps. The first step is labelled "Time 1: pure parent isotope," the second step is labelled "After 1 half life: 1/2 parent and 1/2 daughter isotope," and the third step is labelled "After 2 half lives: 1/4 parent and 3/4 daughter isotopes."
A diagram with 3 yellow squares with arrows pointing to indicate steps. The first step is labelled "Time 1: pure parent isotope," the second step is labelled "After 1 half life: 1/2 parent and 1/2 daughter isotope," and the third step is labelled "After 2 half lives: 1/4 parent and 3/4 daughter isotopes."

Core
Cross-section of the Earth with lithosphere, mantle, and the core divided into the metallic liquid core and the solid inner core.
Cross-section of the Earth with lithosphere, mantle, and the core divided into the metallic liquid core and the solid inner core.

Creep En Echelon
En echelon shears crossing street, Hayward Hayward, California. The street shows en echelon shears crossing Foothill Boulevard in San Leandro, just to the north of Hayward. Here the shear zone is quite narrow.
En echelon shears crossing street, Hayward Hayward, California. The street shows en echelon shears crossing Foothill Boulevard in San Leandro, just to the north of Hayward. Here the shear zone is quite narrow.

earthquake seismogram.gif
When seismologists think of an earthquake, this image of a seismogram is what comes to their minds.
When seismologists think of an earthquake, this image of a seismogram is what comes to their minds.

Epicenter Hypocenter Diagram
Diagram showing the epicenter and hypocenter.
The epicenter is the point on the earth's surface vertically above the hypocenter (or focus), point in the crust where a seismic rupture begins.
Diagram showing the epicenter and hypocenter.
The epicenter is the point on the earth's surface vertically above the hypocenter (or focus), point in the crust where a seismic rupture begins.

Fault Plane Diagram
Fault plane diagram. (Image courtesy of Kian H. Chong, Univ. of California, Davis)
Fault plane diagram. (Image courtesy of Kian H. Chong, Univ. of California, Davis)