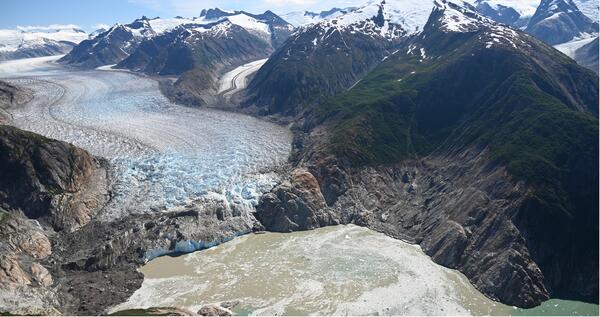
2025 Tracy Arm Landslide Runup Zone and South Sawyer Glacier
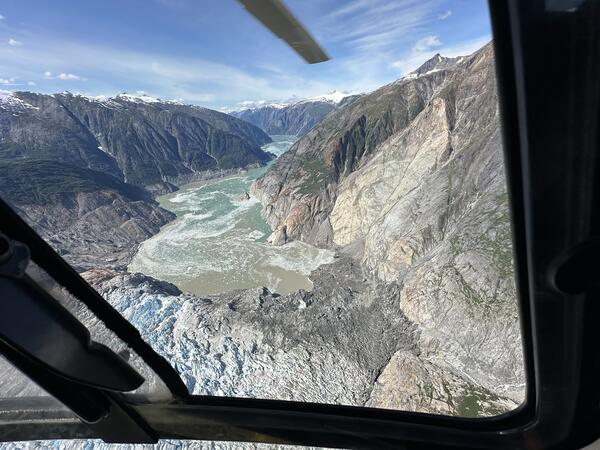
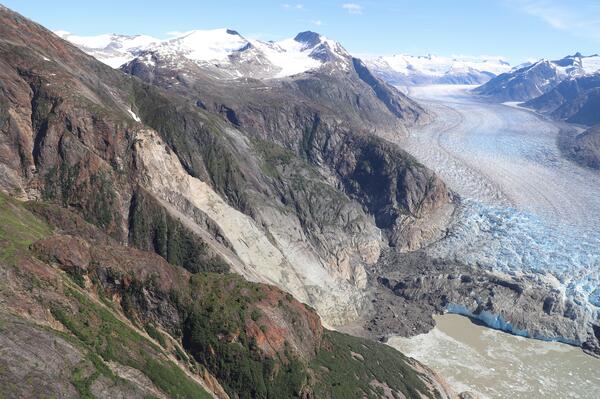
2025 Tracy Arm Landslide Runup Zone and South Sawyer GlacierOblique aerial photo of the August 10, 2025 landslide across-fiord runup zone and South Sawyer Glacier captured during a field reconnaissance overflight on August 13, 2025. Look direction is to the southeast.