2024 Pedersen Glacier Lagoon Landslide Tsunami Damage
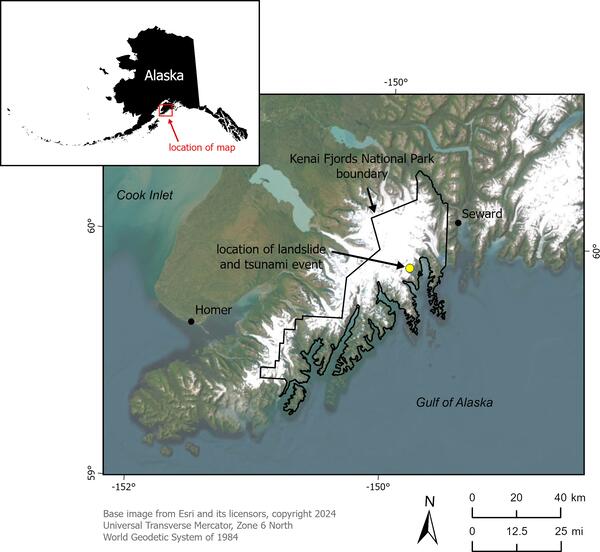
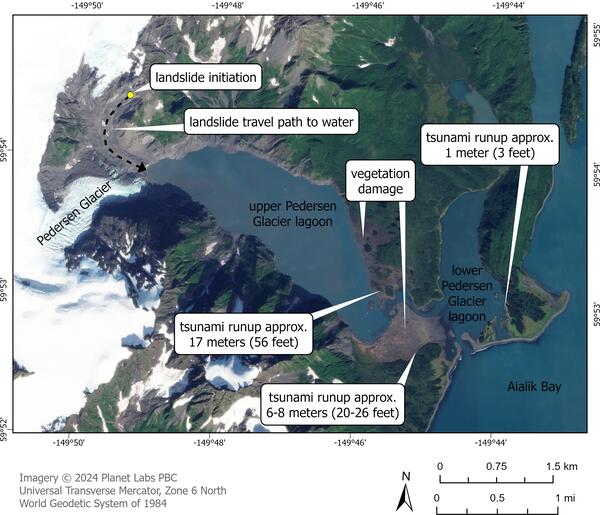
2024 Pedersen Glacier Lagoon Landslide Tsunami DamageTsunami damage between the upper and lower portions of the lagoon from the landslide-generated tsunami from the 2024 Pedersen Glacier lagoon landslide in Alaska. It moved toward the east at the western shore and uplands of the landform between the lagoons.