U.S. flag

An official website of the United States government

Videos

Videos featuring Oregon Water Science Center activities and staff.

Filter Total Items: 29
Welcome to the USGS GeoLog Locator

Welcome to the USGS GeoLog Locator, an online tool for viewing and downloading digital borehole geophysical logs. These borehole logs are used to answer scientific questions about things like groundwater availability, geologic structure of the Earth, and certain characteristics of the structure of the soil and rock formations.

Welcome to the USGS GeoLog Locator, an online tool for viewing and downloading digital borehole geophysical logs. These borehole logs are used to answer scientific questions about things like groundwater availability, geologic structure of the Earth, and certain characteristics of the structure of the soil and rock formations.

DataGrapher: Introduction and Navigation Menu

The USGS Data Grapher is a set of internet-based tools that allows users to create customized graphs and tables of continuous monitoring data, including water-quality, meteorological, and streamflow data. Each tool or feature performs a particular task...
 

The USGS Data Grapher is a set of internet-based tools that allows users to create customized graphs and tables of continuous monitoring data, including water-quality, meteorological, and streamflow data. Each tool or feature performs a particular task...
 

DataGrapher: Quick Overview

The Data Grapher is a set of online tools that allow users to create customized graphs and tables of a whole variety of time-series data that are served up by the U.S. Geological Survey. When you visit the USGS Data Grapher site for the Oregon Water Science Center, this is the first page you will see.

The Data Grapher is a set of online tools that allow users to create customized graphs and tables of a whole variety of time-series data that are served up by the U.S. Geological Survey. When you visit the USGS Data Grapher site for the Oregon Water Science Center, this is the first page you will see.

DataGrapher: Setting Up Your First Graph

The most basic function possible with the USGS Data Grapher is the one site, one parameter plot. Starting with the Time Series, One Site feature, you can select any of the sites that have been loaded into the Data Grapher system; for the Oregon Data Grapher, data from nearly 300 monitoring sites from Oregon and southwest Washington have been loaded.

The most basic function possible with the USGS Data Grapher is the one site, one parameter plot. Starting with the Time Series, One Site feature, you can select any of the sites that have been loaded into the Data Grapher system; for the Oregon Data Grapher, data from nearly 300 monitoring sites from Oregon and southwest Washington have been loaded.

DataGrapher: Adjusting A Graph

Once you have generated your graph, you have a variety of options of where to go next. First, you can download the data that you used to create the graph by selecting here. This allows you to import the data directly into a spreadsheet or database package where you can do your own custom manipulation.

Once you have generated your graph, you have a variety of options of where to go next. First, you can download the data that you used to create the graph by selecting here. This allows you to import the data directly into a spreadsheet or database package where you can do your own custom manipulation.

DataGrapher: Walk-Through Guide

The Data Grapher is a set of online tools that allow users to create customized graphs and tables of a whole variety of time-series data that are served up by the U.S. Geological Survey. Now, if you've never been here before, it probably would be helpful to check out the Help system. Under the Help menu, there are a number of tutorials and example graphs.

The Data Grapher is a set of online tools that allow users to create customized graphs and tables of a whole variety of time-series data that are served up by the U.S. Geological Survey. Now, if you've never been here before, it probably would be helpful to check out the Help system. Under the Help menu, there are a number of tutorials and example graphs.

Find Jobs at USGS
Find Jobs at USGS
Find Jobs at USGS

Sometimes it is difficult to know where to start when looking for a job. At the USGS it's easy. All our jobs go through the usajobs.gov website. Interested in a career with the USGS? Start with science. Start with usajobs.gov.

Sometimes it is difficult to know where to start when looking for a job. At the USGS it's easy. All our jobs go through the usajobs.gov website. Interested in a career with the USGS? Start with science. Start with usajobs.gov.

Chapter 1: Faces of the USGS

USGS video series highlighting the individuals who make up the U.S. Geological Survey. We are USGS, these are our stories.

USGS video series highlighting the individuals who make up the U.S. Geological Survey. We are USGS, these are our stories.

Chapter 2: Uranium Miner's Daughter

USGS video series highlighting the individuals who make up the U.S. Geological Survey. We are USGS, these are our stories. This episode focuses on USGS research engineer Tanya Gallegos.

USGS video series highlighting the individuals who make up the U.S. Geological Survey. We are USGS, these are our stories. This episode focuses on USGS research engineer Tanya Gallegos.

Chapter 3: Mom and Mentor

USGS video series highlighting the individuals who make up the U.S. Geological Survey. We are USGS, these are our stories. This episode focuses on USGS Chief-of-Staff for Natural Hazards Martha Garcia.

USGS video series highlighting the individuals who make up the U.S. Geological Survey. We are USGS, these are our stories. This episode focuses on USGS Chief-of-Staff for Natural Hazards Martha Garcia.

Chapter 4: Fortunate Son

USGS video series highlighting the individuals who make up the U.S. Geological Survey. We are USGS, these are our stories. This episode focuses on USGS Southeast Region Director Jess Weaver.

USGS video series highlighting the individuals who make up the U.S. Geological Survey. We are USGS, these are our stories. This episode focuses on USGS Southeast Region Director Jess Weaver.

Debris Flow Monitoring at Chalk Cliffs, CO (2014)

The USGS and its cooperators have installed debris-flow monitoring equipment in the largest drainage basin at Chalk Cliffs, CO. Data collection at this site supports research on the hydrologic factors that control debris-flow initiation, entrainment, and flow dynamics.

The USGS and its cooperators have installed debris-flow monitoring equipment in the largest drainage basin at Chalk Cliffs, CO. Data collection at this site supports research on the hydrologic factors that control debris-flow initiation, entrainment, and flow dynamics.

Water Temp Modeling Animation: Middle Fork Willamette River Reservoirs

CE-QUAL-W2 temperature model animation of Hills Creek, Lookout Point, and Dexter Reservoirs on the Middle Fork Willamette River. Data are modeled for calendar year 2011. For supporting information, see http://pubs.usgs.gov/of/2013/1186/.

CE-QUAL-W2 temperature model animation of Hills Creek, Lookout Point, and Dexter Reservoirs on the Middle Fork Willamette River. Data are modeled for calendar year 2011. For supporting information, see http://pubs.usgs.gov/of/2013/1186/.

Water Temp Modeling Animation: Middle Fork Willamette

CE-QUAL-W2 temperature model animation of Hills Creek, Lookout Point, and Dexter Lakes on the Middle Fork Willamette River.

CE-QUAL-W2 temperature model animation of Hills Creek, Lookout Point, and Dexter Lakes on the Middle Fork Willamette River.

Suspended-Sediment Sampling from a Cableway

USGS Hydrologic Technician Heather Bragg collects suspended-sediment sample from a cableway downstream from Fall Creek Reservoir. Reservoir was drawn down to purge sediment and trapped fish from behind dam in December 2012.

USGS Hydrologic Technician Heather Bragg collects suspended-sediment sample from a cableway downstream from Fall Creek Reservoir. Reservoir was drawn down to purge sediment and trapped fish from behind dam in December 2012.

Acoustic Doppler Measurement from a Cableway

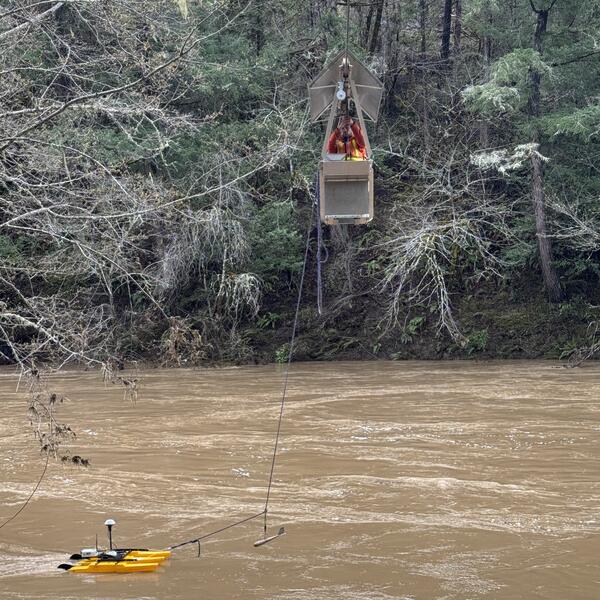
USGS Hydrologist Liam Schenk measures sediment transport using an acoustic doppler instrument suspended from a cableway downstream from Fall Creek Reservoir. Reservoir was drawn down to purge sediment and trapped fish from behind dam in December 2012.

USGS Hydrologist Liam Schenk measures sediment transport using an acoustic doppler instrument suspended from a cableway downstream from Fall Creek Reservoir. Reservoir was drawn down to purge sediment and trapped fish from behind dam in December 2012.

Turbid Water in Fall Creek

Muddy, or turbid water, caused by suspended-sediment released during Fall Creek Reservoir draw down. Reservoir was drawn down to purge sediment and trapped fish from behind dam in December 2012.

Muddy, or turbid water, caused by suspended-sediment released during Fall Creek Reservoir draw down. Reservoir was drawn down to purge sediment and trapped fish from behind dam in December 2012.

Cableway Pre-Use Inspection

USGS Safety Training Video for cableway pre-use inspection. Training guide for new field personnel to safely and effectively inspect cableway structure and components prior to operation.

USGS Safety Training Video for cableway pre-use inspection. Training guide for new field personnel to safely and effectively inspect cableway structure and components prior to operation.

video thumbnail: Organic Carbon and the World around Us Organic Carbon and the World around Us
Organic Carbon and the World around Us

In this episode, we talk about organic carbon. The benefit of studying carbon extends to many issues, including tracing mercury contamination or investigating disinfection by-products in drinking water treatment. It is amazing what can be discovered by monitoring the volume and flux of carbon through the environment.

In this episode, we talk about organic carbon. The benefit of studying carbon extends to many issues, including tracing mercury contamination or investigating disinfection by-products in drinking water treatment. It is amazing what can be discovered by monitoring the volume and flux of carbon through the environment.

What's in Our Water?

In this episode, we are going to investigate more than just the substance "water." We are going to examine what is in our nations' water, how we at the U.S. Geological Survey monitor it, and what tools we have developed to aid those who want to explore more about our planet's most abundant resource. This is the USGS Oregon Science Podcast.

In this episode, we are going to investigate more than just the substance "water." We are going to examine what is in our nations' water, how we at the U.S. Geological Survey monitor it, and what tools we have developed to aid those who want to explore more about our planet's most abundant resource. This is the USGS Oregon Science Podcast.