PubTalk 5/2017 — Underwater secrets of the Hayward fault zone
PubTalk 5/2017 — Underwater secrets of the Hayward fault zoneTitle: Underwater Secrets of the Hayward Fault Zone: Integrated 3D imaging to understand earthquake hazards

Official websites use .gov
A .gov website belongs to an official government organization in the United States.
Secure .gov websites use HTTPS
A lock () or https:// means you’ve safely connected to the .gov website. Share sensitive information only on official, secure websites.
From Point Conception to Cape Mendocino, seafloor faults have been, in the past, mapped in varying ways and without enough detail to assess their earthquake potential. To provide this important information, USGS uses advanced technology to image offshore faults that could trigger devastating earthquakes near densely populated areas and a nuclear power plant.

USGS uses sophisticated techniques to truly understand the Queen Charlotte-Fairweather (QCF) fault system’s hazard potential in southeastern Alaska.

USGS aims to boost our knowledge about faults on the seafloor offshore of southern California (SoCal), so they can be included in hazard assessments.

USGS collects modern, high-resolution seafloor imaging offshore of SoCal, to map historical underwater landslides and identify where future threats may exist.

Researching earthquake hazards on land has its challenges; fault lines can run right through cities, where it’s difficult to use sound-generating equipment to image the underground fractures. In marine environments, a ship can send sound through water and sediment and back to produce a clear image, but other problems may arise. In San Pablo Bay, for example, USGS scientists wanted to pin down the location of an important segment of the Hayward fault—a fault considered most likely to produce the next large earthquake in the San Francisco Bay area. However, San Pablo Bay averages only 2 meters deep—too shallow for a large ship—and gas just beneath the seafloor interferes with the imaging. So, USGS geophysicist Janet Watt used a small boat that could operate in shallow waters to launch seismic equipment called a “chirp” floated on pontoons. What she found from the very detailed images beneath the seafloor confirmed suspicions that the Hayward fault actually heads toward the Rodgers Creek fault, a relationship that could generate a larger magnitude earthquake—even stronger than the 1989 magnitude 6.9 Loma Prieta earthquake—if both rupture together.

The Central California coast is known for its natural beauty. Much of this stunning landscape is shaped by movements along active faults between the North American and Pacific tectonic plates on the U.S. west coast. The same forces that create the high coastal mountains and control the paths of coastal rivers also lead to devastating earthquakes that endanger coastal populations and infrastructure. One important example—the Great 1906 San Francisco earthquake (magnitude 7.8)—occurred along the San Andreas fault a few kilometers off the coast of San Francisco. This event resulted in about 3,000 deaths and destroyed more than three quarters of San Francisco.
The USGS plays a prominent role in assessing earthquake hazards, providing information that informs building codes, insurance rate structures, relicensing of nuclear power plants, risk evaluations, and public policy. Such assessment depends on accurate descriptions of faults, including their location, length, geometry, slip rate, and rupture history, as well as the connections between faults. Documenting the offshore portions of significant active faults in central and northern California contributes crucial information to the national earthquake-hazard assessment effort. Mapping efforts in the past have been patchy and used a variety of instruments that produced lower-resolution data. By applying consistent mapping techniques with state-of-the art tools, scientists can vastly improve knowledge about faults, and compare data collected at different times and in different regions.
The most significant faults within the plate boundary in central and northern California include the San Andreas, San Gregorio-Hosgri, and Hayward-Rodgers Creek fault zones. Each of these fault zones has important offshore sections that, until recently, were not mapped in great detail. For 300 kilometers between Pacifica and Cape Mendocino, about 60 percent of the trace of the San Andreas fault lies beneath the ocean floor. West of the San Andreas fault, the 400-kilometer-long San Gregorio-Hosgri fault extends primarily offshore between Point Conception and Bolinas, and sits within 3 nautical miles (in state waters) of the Diablo Canyon Power Plant. East of the San Andreas fault, the Hayward and Rodgers Creek faults are considered the most likely faults in the San Francisco Bay area to have a damaging (magnitude greater than 6.7) earthquake in the next 30 years. New geophysical evidence suggests the Hayward and Rodgers Creek faults may be directly connected north of San Pablo Bay—resolving a long-standing debate among scientists.

The USGS is collecting higher-resolution offshore geophysical data to better characterize these faults. Scientists bounce sound off the seafloor to image the bottom (bathymetric mapping), or image the layers of sediment and rock beneath the seafloor (seismic mapping). For example, multibeam sonar and chirp systems both use high frequency sound to create detailed views, respectively, of the seafloor and features beneath the seafloor. Lower frequency sound sources, such as the mini-sparker, can penetrate deeper and image as much as 300 meters below the seafloor. In addition, detailed measurements of the Earth’s gravitational and magnetic fields near the seafloor can tell us about the physical properties of rocks on and below the seafloor, and help scientists locate and estimate the shape (dip) of the faults that cut those rocks.

Since 2008, 18 research cruises spanning nearly 200 days at sea have given USGS scientists the opportunity to collect more than 7,000 kilometers of high-resolution seismic data and magnetic profiles, and to map over 400 square kilometers of seafloor in very high detail. Running the seismic equipment across a fault multiple times—in straight lines from one-half to one kilometer apart—can pick up valuable fault details. For example, establishing how features on the seafloor, or features below the seafloor, are offset can reveal how fast a fault is moving (slip rate), and when the last earthquake occurred along a fault. Without this level of detailed imaging, it’s difficult to accurately describe faults and their interactions.
This work involves many outside collaborators, including students and faculty at Oregon State University. The California Seafloor Mapping Program (CSMP), funded in large part by the state of California, has supported the collection of nearly 5,000 square kilometers of high-resolution bathymetric data in state waters (from shore out to 3 nautical miles), including virtually all of the central and northern California coast as well as San Pablo Bay just north of San Francisco.
Mapping along the San Andreas fault between San Francisco and Cape Mendocino has revealed the complexity of strike-slip faults, including many strands of the fault that are active, and fault-bounded basins and uplifts. Uplifts within the fault interrupt sediment movement in several locations and help control the shape of the coast. Sediment-filled basins can amplify ground motion and shaking in an earthquake, and fault strands can indicate possible fault movement along other branches, making it challenging to calculate slip rates. Additionally, near Bodega Bay, the main San Andreas fault was found to be located about 800 meters west of its previously mapped location. Adjacent to the fault, strong ground motions have generated significant seafloor failures (debris flows) on the gently sloping (1°) shelf. Such areas are important to avoid when placing offshore structures. Farther north, USGS mapped the offshore section of the San Andreas for the first time in detail from where it goes offshore at Cape Arena to its termination at the junction of three tectonic plates off Cape Mendocino, California.


USGS mapped the Hosgri fault zone in high-resolution for about 100 kilometers between Piedras Blancas and Point Sal in central California, where the fault runs within 3 nautical miles of the Diablo Canyon Power Plant. This comprehensive imaging helped highlight fault connections, which are important because longer faults can produce larger earthquakes. This level of detail also revealed the diversity of deformation along the fault, showing uplifts and depressions from small bends—a complexity not captured by previous mapping techniques. By using cutting-edge analysis, USGS scientists also examined seismic data in three dimensions along a fault bend in the Hosgri fault zone to help visualize the fault and spot pathways that fluids might follow.
Comprehensive mapping is important not only for capturing nuances of the fault, but also for slip rate calculations. In the northern section, the Hosgri fault diverges into two strands, running north and west around a central uplifted block—Piedras Blancas. Slip rate on the northerly strand is about 2.6 millimeters per year, but overall slip rate must be established on both strands. Slip rate likely varies along the Hosgri fault depending on whether adjacent faults are merging or diverging from the main fault. USGS is now extending this detailed mapping both north and south along the fault.
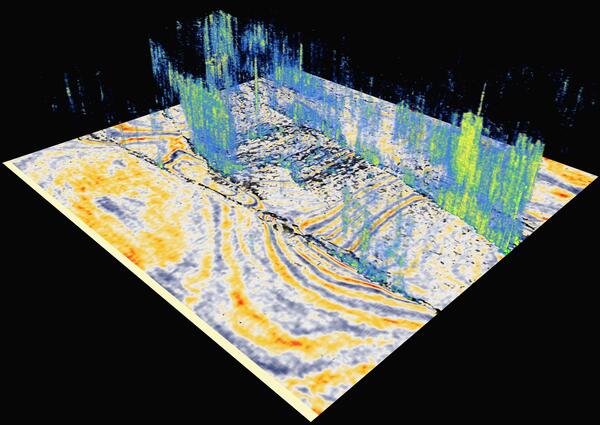

USGS scientists have been using marine magnetic and chirp seismic reflection data to help create a 3D model of the Hayward and Rodgers Creek faults, whose geometry beneath San Pablo Bay (a northern arm of San Francisco Bay) is not well known. Chirp seismic profiles collected in 2014 show a previously unrecognized strand of the Hayward fault within the bay that may connect with the Rodgers Creek fault onshore. A direct connection makes it easier for an earthquake to rupture both these faults, potentially creating a larger earthquake than if the two faults were to rupture independently. This work follows a series of studies by the USGS in which scientists have discovered that the Hayward, Calaveras, and San Andreas faults are more interconnected than previously thought.


Below are the current studies of the “U.S. West Coast and Alaska Marine Geohazards” Project.


Below are multimedia items associated with this project.

Title: Underwater Secrets of the Hayward Fault Zone: Integrated 3D imaging to understand earthquake hazards
Title: Underwater Secrets of the Hayward Fault Zone: Integrated 3D imaging to understand earthquake hazards

All clips show the deck of a barge in San Pablo Bay, California.
All clips show the deck of a barge in San Pablo Bay, California.
From Point Conception to Cape Mendocino, seafloor faults have been, in the past, mapped in varying ways and without enough detail to assess their earthquake potential. To provide this important information, USGS uses advanced technology to image offshore faults that could trigger devastating earthquakes near densely populated areas and a nuclear power plant.
USGS uses sophisticated techniques to truly understand the Queen Charlotte-Fairweather (QCF) fault system’s hazard potential in southeastern Alaska.
USGS aims to boost our knowledge about faults on the seafloor offshore of southern California (SoCal), so they can be included in hazard assessments.
USGS collects modern, high-resolution seafloor imaging offshore of SoCal, to map historical underwater landslides and identify where future threats may exist.
Researching earthquake hazards on land has its challenges; fault lines can run right through cities, where it’s difficult to use sound-generating equipment to image the underground fractures. In marine environments, a ship can send sound through water and sediment and back to produce a clear image, but other problems may arise. In San Pablo Bay, for example, USGS scientists wanted to pin down the location of an important segment of the Hayward fault—a fault considered most likely to produce the next large earthquake in the San Francisco Bay area. However, San Pablo Bay averages only 2 meters deep—too shallow for a large ship—and gas just beneath the seafloor interferes with the imaging. So, USGS geophysicist Janet Watt used a small boat that could operate in shallow waters to launch seismic equipment called a “chirp” floated on pontoons. What she found from the very detailed images beneath the seafloor confirmed suspicions that the Hayward fault actually heads toward the Rodgers Creek fault, a relationship that could generate a larger magnitude earthquake—even stronger than the 1989 magnitude 6.9 Loma Prieta earthquake—if both rupture together.
The Central California coast is known for its natural beauty. Much of this stunning landscape is shaped by movements along active faults between the North American and Pacific tectonic plates on the U.S. west coast. The same forces that create the high coastal mountains and control the paths of coastal rivers also lead to devastating earthquakes that endanger coastal populations and infrastructure. One important example—the Great 1906 San Francisco earthquake (magnitude 7.8)—occurred along the San Andreas fault a few kilometers off the coast of San Francisco. This event resulted in about 3,000 deaths and destroyed more than three quarters of San Francisco.
The USGS plays a prominent role in assessing earthquake hazards, providing information that informs building codes, insurance rate structures, relicensing of nuclear power plants, risk evaluations, and public policy. Such assessment depends on accurate descriptions of faults, including their location, length, geometry, slip rate, and rupture history, as well as the connections between faults. Documenting the offshore portions of significant active faults in central and northern California contributes crucial information to the national earthquake-hazard assessment effort. Mapping efforts in the past have been patchy and used a variety of instruments that produced lower-resolution data. By applying consistent mapping techniques with state-of-the art tools, scientists can vastly improve knowledge about faults, and compare data collected at different times and in different regions.
The most significant faults within the plate boundary in central and northern California include the San Andreas, San Gregorio-Hosgri, and Hayward-Rodgers Creek fault zones. Each of these fault zones has important offshore sections that, until recently, were not mapped in great detail. For 300 kilometers between Pacifica and Cape Mendocino, about 60 percent of the trace of the San Andreas fault lies beneath the ocean floor. West of the San Andreas fault, the 400-kilometer-long San Gregorio-Hosgri fault extends primarily offshore between Point Conception and Bolinas, and sits within 3 nautical miles (in state waters) of the Diablo Canyon Power Plant. East of the San Andreas fault, the Hayward and Rodgers Creek faults are considered the most likely faults in the San Francisco Bay area to have a damaging (magnitude greater than 6.7) earthquake in the next 30 years. New geophysical evidence suggests the Hayward and Rodgers Creek faults may be directly connected north of San Pablo Bay—resolving a long-standing debate among scientists.
The USGS is collecting higher-resolution offshore geophysical data to better characterize these faults. Scientists bounce sound off the seafloor to image the bottom (bathymetric mapping), or image the layers of sediment and rock beneath the seafloor (seismic mapping). For example, multibeam sonar and chirp systems both use high frequency sound to create detailed views, respectively, of the seafloor and features beneath the seafloor. Lower frequency sound sources, such as the mini-sparker, can penetrate deeper and image as much as 300 meters below the seafloor. In addition, detailed measurements of the Earth’s gravitational and magnetic fields near the seafloor can tell us about the physical properties of rocks on and below the seafloor, and help scientists locate and estimate the shape (dip) of the faults that cut those rocks.
Since 2008, 18 research cruises spanning nearly 200 days at sea have given USGS scientists the opportunity to collect more than 7,000 kilometers of high-resolution seismic data and magnetic profiles, and to map over 400 square kilometers of seafloor in very high detail. Running the seismic equipment across a fault multiple times—in straight lines from one-half to one kilometer apart—can pick up valuable fault details. For example, establishing how features on the seafloor, or features below the seafloor, are offset can reveal how fast a fault is moving (slip rate), and when the last earthquake occurred along a fault. Without this level of detailed imaging, it’s difficult to accurately describe faults and their interactions.
This work involves many outside collaborators, including students and faculty at Oregon State University. The California Seafloor Mapping Program (CSMP), funded in large part by the state of California, has supported the collection of nearly 5,000 square kilometers of high-resolution bathymetric data in state waters (from shore out to 3 nautical miles), including virtually all of the central and northern California coast as well as San Pablo Bay just north of San Francisco.
Mapping along the San Andreas fault between San Francisco and Cape Mendocino has revealed the complexity of strike-slip faults, including many strands of the fault that are active, and fault-bounded basins and uplifts. Uplifts within the fault interrupt sediment movement in several locations and help control the shape of the coast. Sediment-filled basins can amplify ground motion and shaking in an earthquake, and fault strands can indicate possible fault movement along other branches, making it challenging to calculate slip rates. Additionally, near Bodega Bay, the main San Andreas fault was found to be located about 800 meters west of its previously mapped location. Adjacent to the fault, strong ground motions have generated significant seafloor failures (debris flows) on the gently sloping (1°) shelf. Such areas are important to avoid when placing offshore structures. Farther north, USGS mapped the offshore section of the San Andreas for the first time in detail from where it goes offshore at Cape Arena to its termination at the junction of three tectonic plates off Cape Mendocino, California.
USGS mapped the Hosgri fault zone in high-resolution for about 100 kilometers between Piedras Blancas and Point Sal in central California, where the fault runs within 3 nautical miles of the Diablo Canyon Power Plant. This comprehensive imaging helped highlight fault connections, which are important because longer faults can produce larger earthquakes. This level of detail also revealed the diversity of deformation along the fault, showing uplifts and depressions from small bends—a complexity not captured by previous mapping techniques. By using cutting-edge analysis, USGS scientists also examined seismic data in three dimensions along a fault bend in the Hosgri fault zone to help visualize the fault and spot pathways that fluids might follow.
Comprehensive mapping is important not only for capturing nuances of the fault, but also for slip rate calculations. In the northern section, the Hosgri fault diverges into two strands, running north and west around a central uplifted block—Piedras Blancas. Slip rate on the northerly strand is about 2.6 millimeters per year, but overall slip rate must be established on both strands. Slip rate likely varies along the Hosgri fault depending on whether adjacent faults are merging or diverging from the main fault. USGS is now extending this detailed mapping both north and south along the fault.
USGS scientists have been using marine magnetic and chirp seismic reflection data to help create a 3D model of the Hayward and Rodgers Creek faults, whose geometry beneath San Pablo Bay (a northern arm of San Francisco Bay) is not well known. Chirp seismic profiles collected in 2014 show a previously unrecognized strand of the Hayward fault within the bay that may connect with the Rodgers Creek fault onshore. A direct connection makes it easier for an earthquake to rupture both these faults, potentially creating a larger earthquake than if the two faults were to rupture independently. This work follows a series of studies by the USGS in which scientists have discovered that the Hayward, Calaveras, and San Andreas faults are more interconnected than previously thought.
Below are the current studies of the “U.S. West Coast and Alaska Marine Geohazards” Project.
Below are multimedia items associated with this project.
Title: Underwater Secrets of the Hayward Fault Zone: Integrated 3D imaging to understand earthquake hazards
Title: Underwater Secrets of the Hayward Fault Zone: Integrated 3D imaging to understand earthquake hazards
All clips show the deck of a barge in San Pablo Bay, California.
All clips show the deck of a barge in San Pablo Bay, California.