
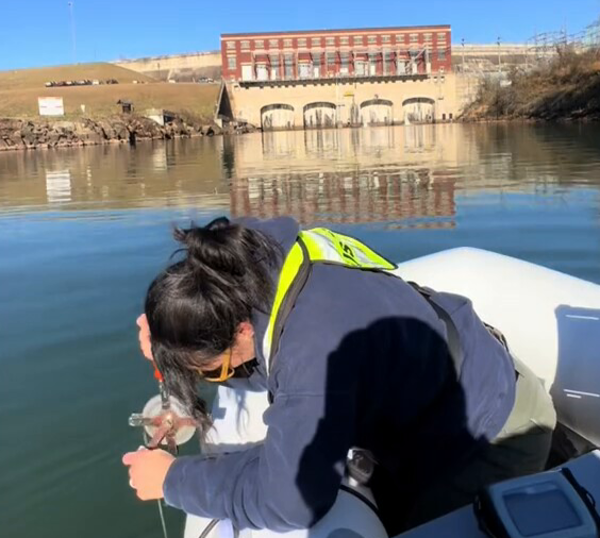
Laura Lapolice taking water-quality sample at Mountain Island, NC. Near USGS gage 0214267602.
Images
SAWSC Images
Filter Total Items: 102
Laura Lapolice taking water-quality sample at Mountain Island, NC
Laura Lapolice taking water-quality sample at Mountain Island, NC. Near USGS gage 0214267602.
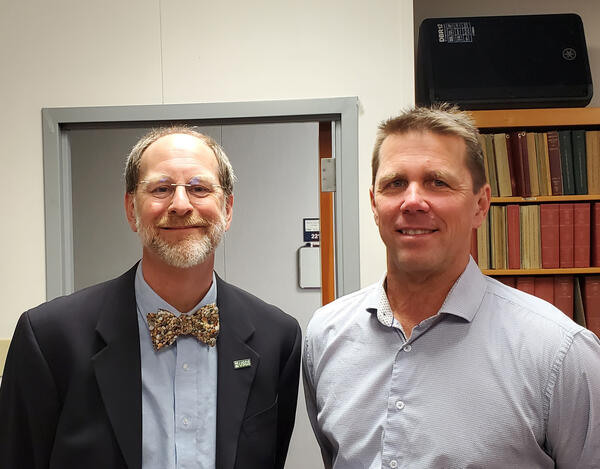
USGS Director David Applegate and South Atlantic Water Science Center Director Vic Engel
USGS Director David Applegate and South Atlantic Water Science Center Director Vic Engel visit Raleigh, North Carolina Office
USGS Director David Applegate and South Atlantic Water Science Center Director Vic Engel visit Raleigh, North Carolina Office
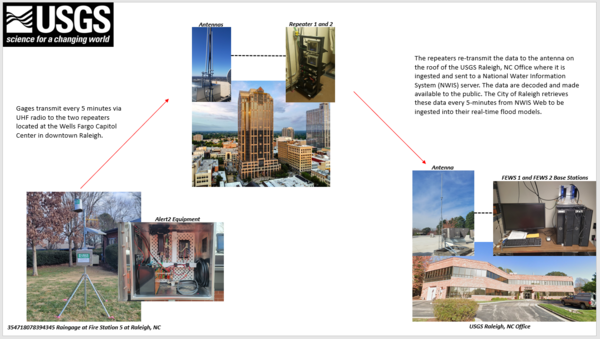
Raleigh, NC Flood Early Warning System System Diagram
System Diagram for Raleigh, NC Flood Early Warning System (FEWS). Gage data is transmitted every 5 minutes via UHF radio signals to repeaters located on a centrally located tall building. The repeaters relays the data to the Raleigh USGS office for processing.
System Diagram for Raleigh, NC Flood Early Warning System (FEWS). Gage data is transmitted every 5 minutes via UHF radio signals to repeaters located on a centrally located tall building. The repeaters relays the data to the Raleigh USGS office for processing.
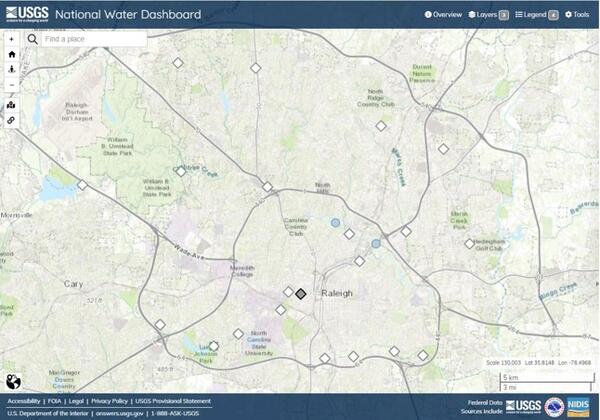
Map of the gages that make up the Raleigh Flood Early Warning System (FEWS)
Map of the gages that make up the Raleigh Flood Early Warning System (FEWS). Image from the USGS National Water Dashboard.
Map of the gages that make up the Raleigh Flood Early Warning System (FEWS). Image from the USGS National Water Dashboard.

Gage Greatness Bracket Round 1
At the USGS, we monitor our nation’s water. Our data informs many people, from kayakers to water managers. Gage Greatness allows any Twitter user to vote for their favorite gage (data collection station).
At the USGS, we monitor our nation’s water. Our data informs many people, from kayakers to water managers. Gage Greatness allows any Twitter user to vote for their favorite gage (data collection station).
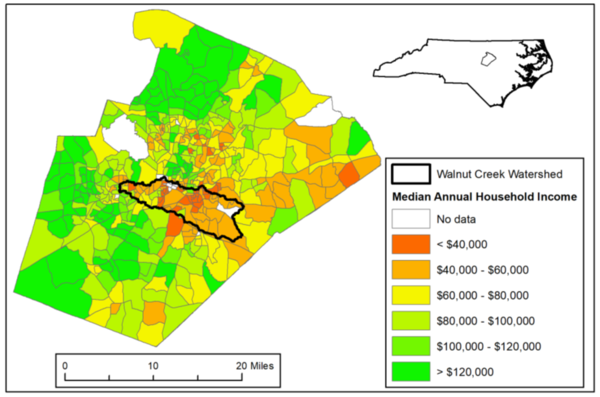
Map of Walnut Creek Watershed and Median Annual Household Income
Map of Walnut Creek Watershed, Raleigh, North Carolina and Median Annual Household Income
Map of Walnut Creek Watershed, Raleigh, North Carolina and Median Annual Household Income
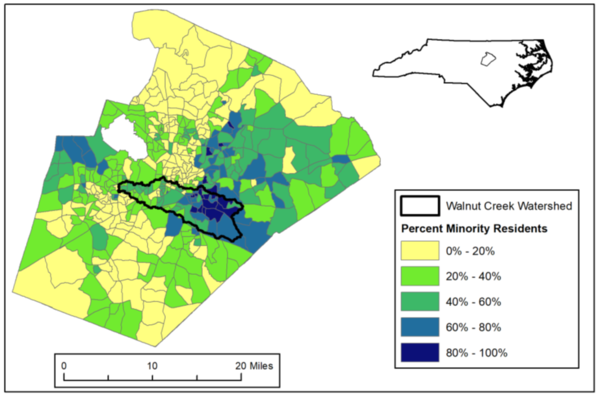
Map of Walnut Creek Watershed and Percent Minority Residents
Map of Walnut Creek Watershed, Raleigh, North Carolina and Percent Minority Residents
Map of Walnut Creek Watershed, Raleigh, North Carolina and Percent Minority Residents
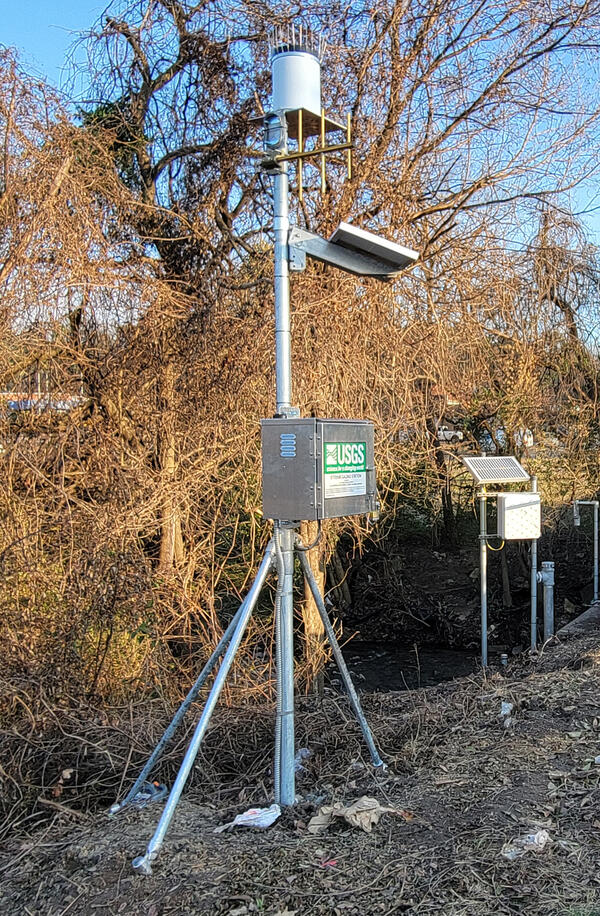
Flood Early Warning System gage 0208732593, Raleigh, NC
Flood Early Warning System, Pigeon House Creek at Fenton Street at Raleigh, NC - 0208732593
Flood Early Warning System, Pigeon House Creek at Fenton Street at Raleigh, NC - 0208732593

High water in the Walnut Creek watershed
High water in the Walnut Creek watershed in Raleigh, North Carolina, in 2022. Flooding can impact nearby infrastructure, including homes, businesses, roads and trails. Credit: Kristina Hopkins, USGS.
High water in the Walnut Creek watershed in Raleigh, North Carolina, in 2022. Flooding can impact nearby infrastructure, including homes, businesses, roads and trails. Credit: Kristina Hopkins, USGS.

PFAS in Select U.S. Tapwater Locations
This USGS map shows the number of PFAS detected in tap water samples from select sites across the nation. The findings are based on a USGS study of samples taken between 2016 and 2021 from private and public supplies at 716 locations. The map does not represent the only locations in the U.S. with PFAS.
This USGS map shows the number of PFAS detected in tap water samples from select sites across the nation. The findings are based on a USGS study of samples taken between 2016 and 2021 from private and public supplies at 716 locations. The map does not represent the only locations in the U.S. with PFAS.
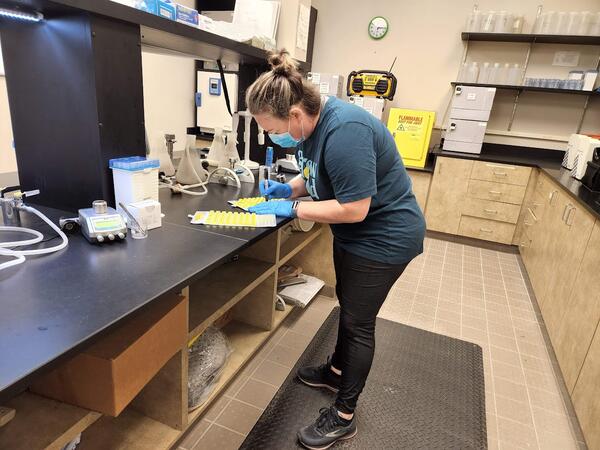
A UHU Hydrologic Technician analyzes a processed bacteria sample, this process quantifies coliforms of Escherichia coli (E. coli)
linkA UHU Hydrologic Technician analyzes a processed bacteria sample, this process quantifies coliforms of Escherichia coli (E. coli)
A UHU Hydrologic Technician analyzes a processed bacteria sample, this process quantifies coliforms of Escherichia coli (E. coli)
linkA UHU Hydrologic Technician analyzes a processed bacteria sample, this process quantifies coliforms of Escherichia coli (E. coli)

Squirrel Treefrog (carousel crop)
Squirrel Treefrog. Photographer William J. Barichivich USGS Southeastern Ecological Science Center
Squirrel Treefrog. Photographer William J. Barichivich USGS Southeastern Ecological Science Center
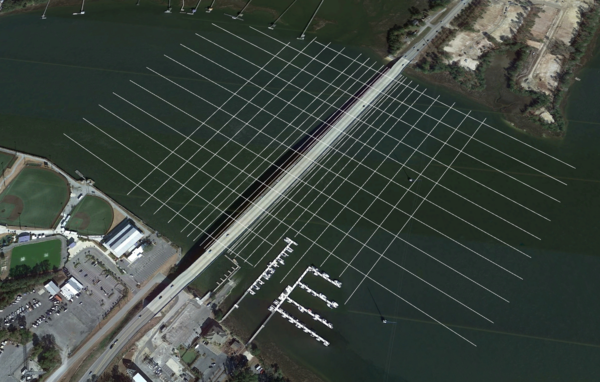
Arial view of riverbed measurements using a grid pattern, upstream and downstream of the bridge.
linkArial view of riverbed measurements using a grid pattern, upstream and downstream of the bridge.
Arial view of riverbed measurements using a grid pattern, upstream and downstream of the bridge.
linkArial view of riverbed measurements using a grid pattern, upstream and downstream of the bridge.
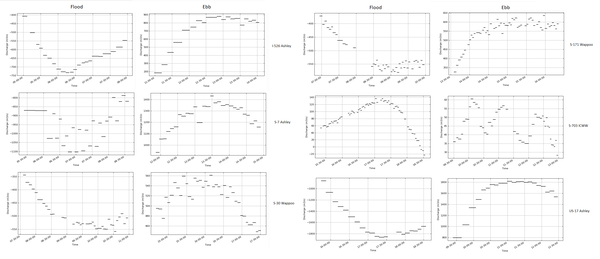
High tide (flood) and low tide (ebb) discharge readings near several South Carolina coastal area bridges.
linkHigh tide (flood) and low tide (ebb) discharge readings near several South Carolina coastal area bridges.
High tide (flood) and low tide (ebb) discharge readings near several South Carolina coastal area bridges.
linkHigh tide (flood) and low tide (ebb) discharge readings near several South Carolina coastal area bridges.

Deploying sensors before Hurricane Ian
As part of the National Oceanographic Partnership Program (NOPP), USGS works with several partner agencies to increase our knowledge of how storms impact and shape our coasts.
As part of the National Oceanographic Partnership Program (NOPP), USGS works with several partner agencies to increase our knowledge of how storms impact and shape our coasts.

Sensor deployed before Hurricane Ian
As part of the National Oceanographic Partnership Program (NOPP), USGS works with several partner agencies to increase our knowledge of how storms impact and shape our coasts.
As part of the National Oceanographic Partnership Program (NOPP), USGS works with several partner agencies to increase our knowledge of how storms impact and shape our coasts.

Low Flow Site Map for Georgia, North and South Carolina
Low Flow Regionalization Study Site Map for Georgia, North Carolina and South Carolina
Low Flow Regionalization Study Site Map for Georgia, North Carolina and South Carolina