
DYOD (Download Your Own Data): New API available for total water level and coastal change forecasts can aid coastal resilience
Need coastal forecast data? We've got your back. The USGS and NOAA have provided real-time forecasts of total water levels and coastal change along U.S. sandy beaches for almost a decade via an online viewer. Now, you can access the forecasts that power the viewer yourself with a new API (application programming interface)—helping to increase efficiency in addressing coastal resilience challenges.
Total water level (TWL) is the elevation of water levels at the shoreline. On ocean beaches, TWL depends on a combination of tides, surge, and wave runup. As you can likely imagine, forecasting these TWLs is complex, as the geomorphology of the beach can change quite drastically along the coast. With climate change driving increased sea level and more frequent, intense tropical storms, understanding how the coast is expected to change under various conditions is important for making informed decisions about how to manage coastal areas in our changing world.

USGS partners with the National Oceanic and Atmospheric Administration (NOAA) National Weather Service (NWS) and the National Centers for Environmental Prediction (NCEP) to model and provide predictions of these water levels along 3,000 miles of U.S. coastline in the Total Water Level and Coastal Change Forecast Viewer. New upgrades to the viewer allow users to download data from specific forecast sites so they can use the data on their own to better understand coastal processes and storm impacts in their areas of interest.
This model combines NOAA wave and water level predictions with a USGS wave-runup model at specific locations along the coast where measurements of beach elevation and slope have been collected. The combination of these data allows USGS to generate real-time forecasts of how the coast could change—whether the dunes could erode, overwash, or experience inundation.
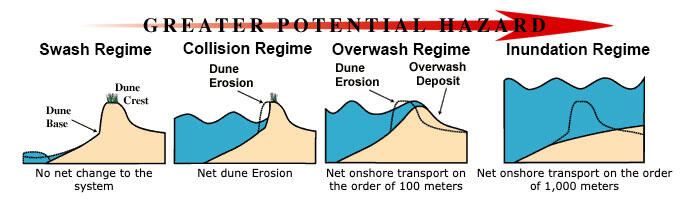
Swash: Total water levels are lower than the dune toe
Collision: Total water levels exceed the dune toe
Overwash: Total water levels exceed the dune crest
Inundation: Storm surge and tide exceed the dune crest
These data are intended to assist regional weather offices and coastal practitioners with understanding the likelihood of coastal change hazards like flooding and erosion, especially during storms. The online viewer is also available for everyone and can even help coastal residents determine sunny-day conditions like high-tide flooding, if a road may be potentially blocked due to overwash, or even whether or not it’ll be a good day for surfing.
How does the API work?
For more specific data access information and instructions, visit the Total Water Level and Coastal Change Forecast API Documentation.
The new version of the TWL and Coastal Change Forecast Viewer includes improvements that allow forecast data access to a wider audience who want to dig more deeply into the forecast. There are two ways to take advantage of this new feature. Users can now retrieve data via a REST-compliant API (where REST refers to Representative State Transfer, a standard for interactive web applications). The API offers TWL and coastal change forecast data with varying degrees of granularity, allowing data access to site-specific forecasts and region-wide overviews that can be exported in multiple formats (e.g., JSON, XML, CSV). Users also have the ability to use a point-and-click download option from within the viewer that provides a quick and efficient way to access the data for the forecast they are viewing.

Download individual forecast data with a click!
If you are viewing a forecast of particular interest in the TWL Viewer and would like to download the 6-day total water level forecast and dune data for further processing and study, you may use the Download This Forecast button found in the map popup for the displayed site. Then simply select the format you would prefer the data to be in from the options of JSON, XML, or CSV. A .zip file will then be made available for you to download. This provides quick access to focused data for users who do not need to automate the data collection process or who don’t need large volumes of data regularly.

Programmatically access forecast data for your own processing.
A Representational State Transfer (REST) compliant API has been made available to permit programmatic download of as much or as little forecast data as you would like via HTTP requests. All current and historical forecast and dune data can be downloaded in either JSON, XML, or CSV format. API clients select the data they want to download by building URLs that identify an endpoint (resource) of interest. This URL mimics the complete data structure. For more information and instructions, view the API Documentation.
Meg Palmsten, Research Oceanographer and Operational Total Water Level and Coastal Change Forecast project lead states,
“While these data have been available in the viewer for quite some time for everyone, including coastal practitioners and emergency managers, these upgrades provide direct access to forecast data right at their fingertips. Now our science can be more effectively incorporated into decision-making processes to better address coastal resilience challenges.”
The viewer is publicly accessible and retains a multi-year history of all TWL and coastal change forecasts along with associated dune elevation data and calculated coastal impacts. Improved access to these data allows stakeholders such as coastal practitioners, researchers, and emergency managers with direct access to critical information that they can use to effectively address coastal resilience across the Nation.
Related

Operational Total Water Level and Coastal Change Forecasts
Related