
Milwaukee River Estuary, March 2016
Images
Upper Midwest Water Science Center images.
Filter Total Items: 574

Milwaukee River Estuary, March 2016

Riverwalk along Milwaukee River, Wisconsin
Confluence of inner harbor and the Milwaukee River along North Riverwalk Way, leading into downtown Milwaukee, Wisconsin in early spring.
Confluence of inner harbor and the Milwaukee River along North Riverwalk Way, leading into downtown Milwaukee, Wisconsin in early spring.
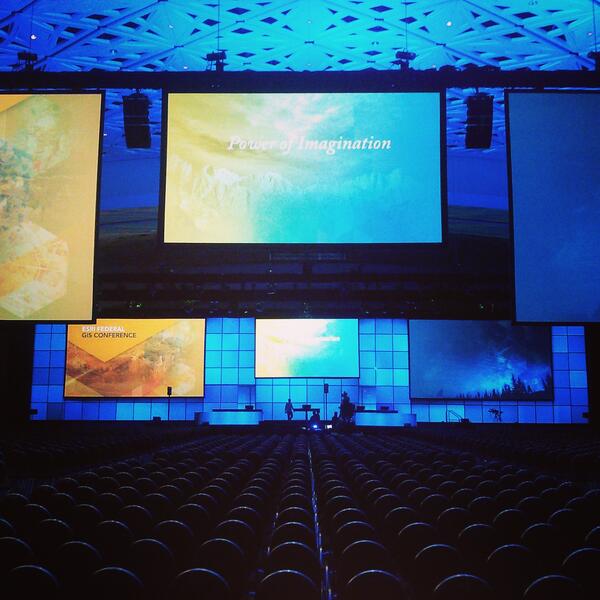
ESRI Federal GIS User Conference Stage
Backlit conference backdrop and stage and a row of seats in the foreground in a low-lit ballroom at the ESRI Federal GIS User Conference.
Backlit conference backdrop and stage and a row of seats in the foreground in a low-lit ballroom at the ESRI Federal GIS User Conference.


Sampling atmospheric mercury at Yellowstone National Park


Fall colors over Lake Boulder, Wisconsin
Photo of the Camp Manito-wish YMCA boat house on Lake Boulder, Wis.
Photo of the Camp Manito-wish YMCA boat house on Lake Boulder, Wis.

Laboratory for Infectious Diseases and the Environment (LIDE)
Laboratory for Infectious Diseases and the Environment (LIDE)Photo of Laboratory for Infectious Diseases and the Environment (LIDE).
Laboratory for Infectious Diseases and the Environment (LIDE)
Laboratory for Infectious Diseases and the Environment (LIDE)Photo of Laboratory for Infectious Diseases and the Environment (LIDE).

Final installation of permeable pavement study test plots
Final installation of permeable pavement study test plotsCompleted installation of test plots: permeable pavers (foreground), permeable concrete (midground), and permeable asphalt (background).
Final installation of permeable pavement study test plots
Final installation of permeable pavement study test plotsCompleted installation of test plots: permeable pavers (foreground), permeable concrete (midground), and permeable asphalt (background).

Collecting a water sample at Turquoise Lake, Alaska
Collecting a water sample at Turquoise Lake, AlaskaA USGS scientist crouches over a seaplane float and collects a water sample from Turquoise Lake in Alaska.
Collecting a water sample at Turquoise Lake, Alaska
Collecting a water sample at Turquoise Lake, AlaskaA USGS scientist crouches over a seaplane float and collects a water sample from Turquoise Lake in Alaska.

Viruses at the Beach
Illustration created by Ben Siebers, USGS scientist, for journal article "Human and bovine viruses and bacteria at three Great Lakes beaches: Environmental variable associations and health risk".
Illustration created by Ben Siebers, USGS scientist, for journal article "Human and bovine viruses and bacteria at three Great Lakes beaches: Environmental variable associations and health risk".

Arsenic speciation analyses of groundwater samples
Arsenic speciation analyses of groundwater samplesArsenic speciation analyses of groundwater samples using ARSOlux biosensor technology. Pictured (left to right), Dr. Mindy Erickson, US Geological Survey; Andreas Koelsch, Helmholtz Centre for Environmental Research; Emily Berquist, Minnesota Department of Health.

Fluorescence amplification curves from a qPCR analysis
Fluorescence amplification curves from a qPCR analysisExample fluorescence amplification curves from a quantitative polymerase chain reaction (qPCR) analysis. By reviewing the fluorescence amplification curves, the concentration of the pathogen in the original sample can be back-calculated from the amount and number of cycles needed to reach the target concentration.

Preparing a sample for qPCR analysis
Joel Stokdyk, LIDE Biologist, prepares a sample for quantitative polymerase chain reaction (qPCR) analysis. qPCR uses fluorescence to quantify the detection of nucleic acids from a targeted pathogen.
Joel Stokdyk, LIDE Biologist, prepares a sample for quantitative polymerase chain reaction (qPCR) analysis. qPCR uses fluorescence to quantify the detection of nucleic acids from a targeted pathogen.

Chloride in Snowy Urban Watersheds
Chloride concentrations in these studied northern U.S.
Chloride concentrations in these studied northern U.S.

Little Plover River Wells
Both irrigation wells and municipal wells affect water levels in the Little Plover River, Wisconsin.
Both irrigation wells and municipal wells affect water levels in the Little Plover River, Wisconsin.

Sediment core retrieval from Lake Erie onboard the RV Lake Guardian
Sediment core retrieval from Lake Erie onboard the RV Lake GuardianSediment core retrieval from Lake Erie onboard the RV Lake Guardian on Lake Erie, Michigan.
Sediment core retrieval from Lake Erie onboard the RV Lake Guardian
Sediment core retrieval from Lake Erie onboard the RV Lake GuardianSediment core retrieval from Lake Erie onboard the RV Lake Guardian on Lake Erie, Michigan.

Scientist collecting an Equal Width Increment (EWI) sample
Scientist collecting an Equal Width Increment (EWI) sampleUSGS scientist collecting an Equal width increment (EWI) sample on Bark River, Merton, WI.
Scientist collecting an Equal Width Increment (EWI) sample
Scientist collecting an Equal Width Increment (EWI) sampleUSGS scientist collecting an Equal width increment (EWI) sample on Bark River, Merton, WI.

USGS Scientists Collecting a Water Sample from a Well at the USGS Bemidji Research Site
USGS Scientists Collecting a Water Sample from a Well at the USGS Bemidji Research SiteU.S. Geological Survey (USGS) scientists collecting a groundwater sample from a well at the USGS Bemidji Crude-Oil Spill Research Site, Minnesota. The scientists monitored in real time the dissolved oxygen, pH, specific conductance, and temperature of the water as the well is pumped so they can know when to collect representative sample.
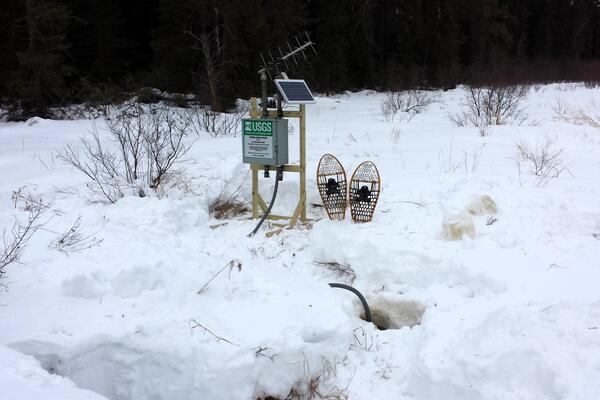
Streamgage 05124982 Filson Creek IN Swse Sec. 24, Near Winton, Minnesota
Streamgage 05124982 Filson Creek IN Swse Sec. 24, Near Winton, MinnesotaA pair of snowshoes rests in the snow next to a small streamgage mounted on a wooden frame, with antenna and solar panel. A black tube connected to the gage enters a hole in the snow in the foreground.
Streamgage 05124982 Filson Creek IN Swse Sec. 24, Near Winton, Minnesota
Streamgage 05124982 Filson Creek IN Swse Sec. 24, Near Winton, Minnesota
Streamgage 05124982 Filson Creek IN Swse Sec. 24, Near Winton, MinnesotaA pair of snowshoes rests in the snow next to a small streamgage mounted on a wooden frame, with antenna and solar panel. A black tube connected to the gage enters a hole in the snow in the foreground.
Streamgage 05124982 Filson Creek IN Swse Sec. 24, Near Winton, Minnesota

Cement-lined channels slowly being removed for stream rehabilitation
Cement-lined channels slowly being removed for stream rehabilitationCement-lined channels such as this one in a section of the Kinnickinnic River at 11th Street in Milwaukee are slowly being removed in stream rehabilitation efforts. Water chemistry remains important, and this channel shows abundant algal growth from excess nutrients and abundant sunlight.