PubTalk 8/2012 — Global Food Security in the 21st Century
PubTalk 8/2012 — Global Food Security in the 21st Century--the increasing need for food production, cropland areas, and agricultural water
by Prasad Thenkabail, Research Geographer

Official websites use .gov
A .gov website belongs to an official government organization in the United States.
Secure .gov websites use HTTPS
A lock () or https:// means you’ve safely connected to the .gov website. Share sensitive information only on official, secure websites.
The GFSAD is a NASA funded project (2023-2028) to provide highest-resolution global cropland data and their water use that contributes towards global food-and-water security in the twenty-first century. The GFSAD products are derived through multi-sensor remote sensing data (e.g., Landsat-series, Sentinel-series, MODIS, AVHRR), secondary data, and field-plot data and aims at documenting cropland dynamics from 2000 to 2030
Monitoring global croplands is imperative for ensuring sustainable water and food security to the people of the world in the Twenty-first Century. The currently available cropland products suffer from major limitations such as:
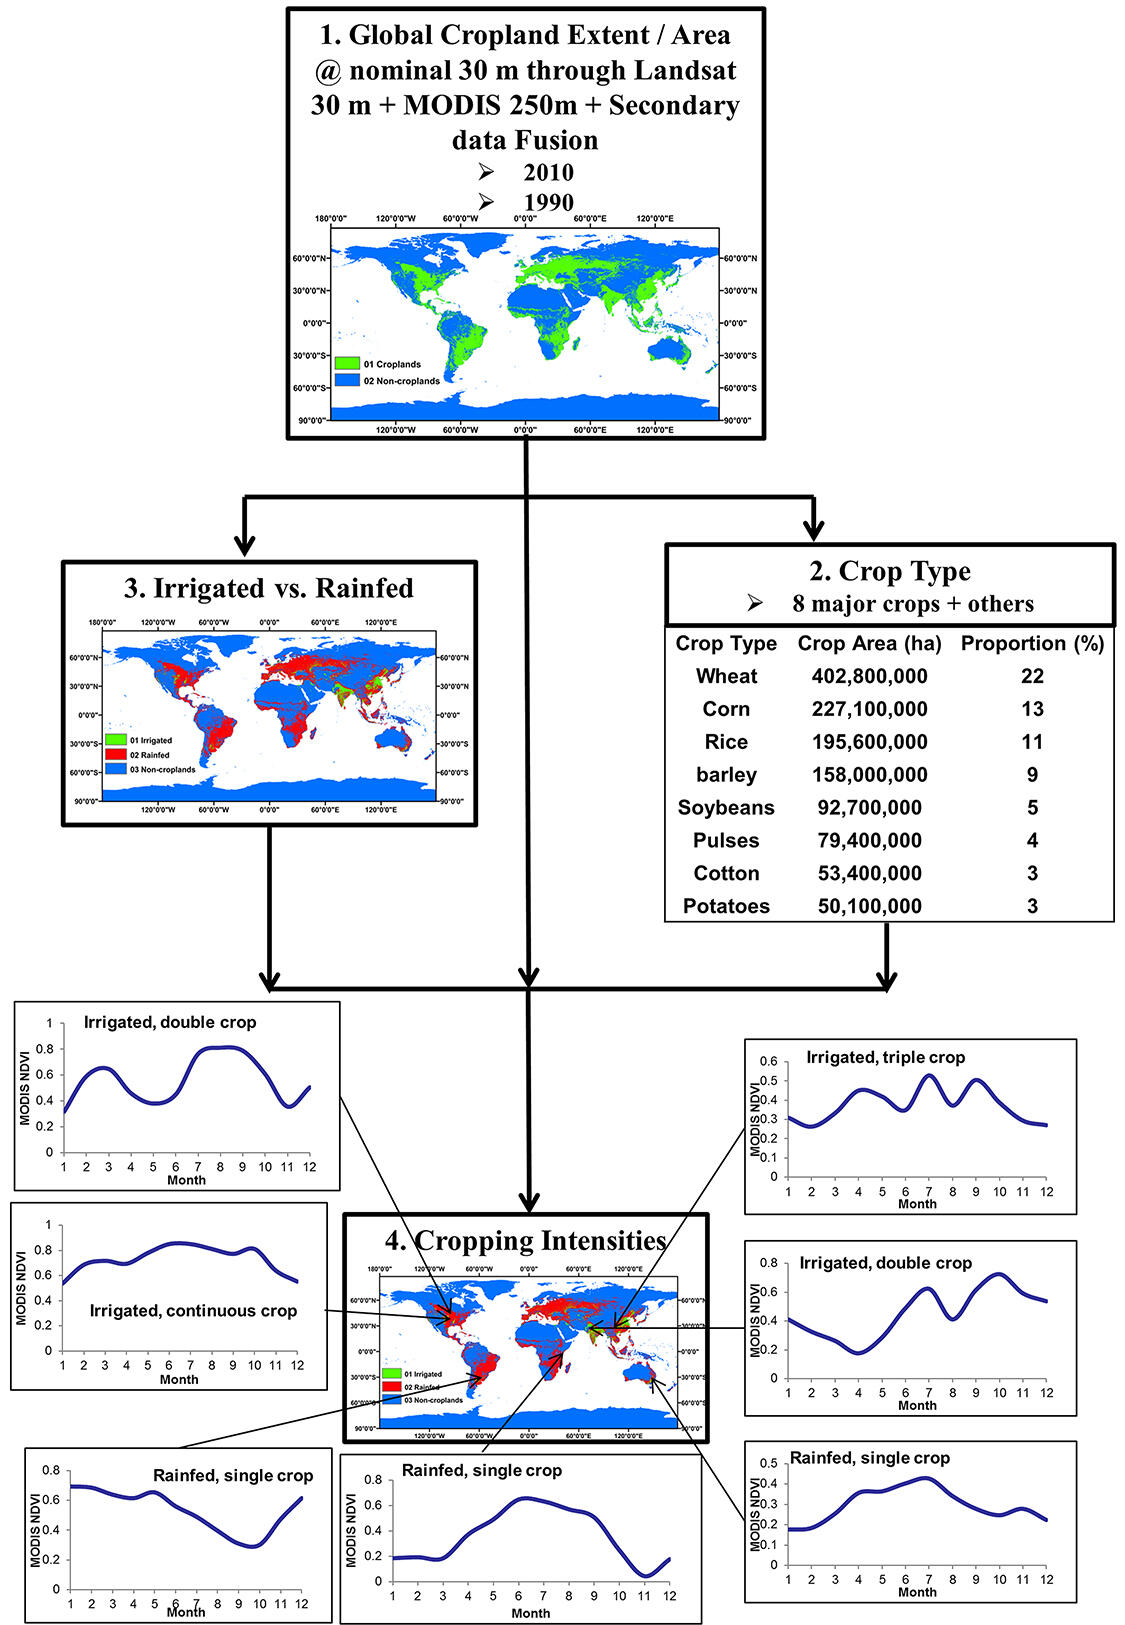
Thereby, the overarching goal of this NASA MEaSUREs GFSAD project is to develop global or large area agricultural cropland products at fine spatial resolution of 30m or better using multiple satellite sensor time-series data, big data analytics, machine learning and cloud computing in support of global food and water security in the twenty-first century. Specific objectives will be to produce four distinct cropland products for nominal years 2020 and 2025. The study will make use of a fusion of Landsat-8, 9, and Sentinel-2A&2B (S2) surface reflectance (SR) products already available in GEE, and NASA’s Harmonized Landsat Sentinel-2 (HLS) Landsat product (HLSL30) for 2013-present and HLS Sentinel-2 product (HLSS30) for 2015-present, that together have sub-5-days global coverage (Masek, et al., 2021, 2022) at nominal 30m resolution (Figure 4). These products are:
1. Landsat-derived Global cropland extent product @ 30m (LGCEP30-2020, LGCEP30-2025).
2. Landsat-derived Global rainfed & irrigated product @ 30m (LGRIP30-2020, LGRIP30-2025).
3. Landsat-derived Global cropping intensity product @ 30m (LGCIP30-2020, LGCIP30-2025).
4. Landsat-derived Global crop type product @ 30m for USA & Canada, and India (LGCTY30-2020USACAN, LGCTY30-2025USACAN, LGCTY30-025India).
The HLSL30 has 10 bands (aerosol, B, G, R, NIRnarrow, SWIR1, SWIR2, cirrus, TIR1, TIR2), and the HLSS30 S2 derived product has 13 bands (aerosol, B, G, R, RE1, RE2, RE3, NIRbroad, NIRnarrow, SWIR1, SWIR2, water vapor, cirrus) (Masek, et al., 2022) along with Fmask cloud mask band and other quality layers. In the earlier global cropland extent product @ 30m (GCEP30) Landsat 8/16-day data were used to time-composite 10-band (blue, green, red, NIR, SWIR1, SWIR2, TIR, EVI, NDWI, NDVI) Landsat 30m data cubes for every 2-4 months over a 3–4-year period (for nominal year 2015) along with 2 additional 30m bands (SRTM elevation and slope). However, the HLSL30 and HLSS30 provide significant advances such as the sub-5-day (2-3 days optimal possible as per Masek et al., 2022) coverage, presence of red-edge bands, many possibilities of data transformations like the vegetation indices, and improved processing and consistency of the HLS data (Masek et al., 2022, Wulder et al., 2019, Roy et al., 2017). We will create analysis ready data (ARD) cubes utilizing these bands to best process each of the cropland products. The ARD cubes, processed in GEE, will involve these bands, their transformations (e.g., vegetation indices), and numerous ancillary data (e.g., climate).
Once the above products are established, other products such as the following can be derived using the above products and certain other inputs:
5) Crop productivity (productivity per unit of land; kg\m2)
6) Water productivity (crop per drop or productivity per unit of water; kg\m3).
The GFSAD has released two global products that can be downloaded from NASA's LP DAAC. These products are:
https://lpdaac.usgs.gov/news/release-of-lgrip30-data-product/
https://lpdaac.usgs.gov/news/release-of-gfsad-30-meter-cropland-extent-products/
These products can also be viewed live at:
https://www.usgs.gov/apps/croplands/app/map
A global synthesis work summarizing the methods and results of the entire GFSAD30 global cropland extent product was released as the USGS Professional Paper 1868:
https://pubs.er.usgs.gov/publication/pp1868
Since the release of the GFSAD30 cropland extent product, the downloads from LPDAAC and citations have been tracked and published in the Open File Report 2022-1001 at:
https://pubs.er.usgs.gov/publication/ofr20221001


Relevant methodology including Models and Algorithms used by the group.


Below are multimedia items associated with this project.

--the increasing need for food production, cropland areas, and agricultural water
by Prasad Thenkabail, Research Geographer
--the increasing need for food production, cropland areas, and agricultural water
by Prasad Thenkabail, Research Geographer
Below are news stories associated with this project.
The GFSAD is a NASA funded project (2023-2028) to provide highest-resolution global cropland data and their water use that contributes towards global food-and-water security in the twenty-first century. The GFSAD products are derived through multi-sensor remote sensing data (e.g., Landsat-series, Sentinel-series, MODIS, AVHRR), secondary data, and field-plot data and aims at documenting cropland dynamics from 2000 to 2030
Monitoring global croplands is imperative for ensuring sustainable water and food security to the people of the world in the Twenty-first Century. The currently available cropland products suffer from major limitations such as:
Thereby, the overarching goal of this NASA MEaSUREs GFSAD project is to develop global or large area agricultural cropland products at fine spatial resolution of 30m or better using multiple satellite sensor time-series data, big data analytics, machine learning and cloud computing in support of global food and water security in the twenty-first century. Specific objectives will be to produce four distinct cropland products for nominal years 2020 and 2025. The study will make use of a fusion of Landsat-8, 9, and Sentinel-2A&2B (S2) surface reflectance (SR) products already available in GEE, and NASA’s Harmonized Landsat Sentinel-2 (HLS) Landsat product (HLSL30) for 2013-present and HLS Sentinel-2 product (HLSS30) for 2015-present, that together have sub-5-days global coverage (Masek, et al., 2021, 2022) at nominal 30m resolution (Figure 4). These products are:
1. Landsat-derived Global cropland extent product @ 30m (LGCEP30-2020, LGCEP30-2025).
2. Landsat-derived Global rainfed & irrigated product @ 30m (LGRIP30-2020, LGRIP30-2025).
3. Landsat-derived Global cropping intensity product @ 30m (LGCIP30-2020, LGCIP30-2025).
4. Landsat-derived Global crop type product @ 30m for USA & Canada, and India (LGCTY30-2020USACAN, LGCTY30-2025USACAN, LGCTY30-025India).
The HLSL30 has 10 bands (aerosol, B, G, R, NIRnarrow, SWIR1, SWIR2, cirrus, TIR1, TIR2), and the HLSS30 S2 derived product has 13 bands (aerosol, B, G, R, RE1, RE2, RE3, NIRbroad, NIRnarrow, SWIR1, SWIR2, water vapor, cirrus) (Masek, et al., 2022) along with Fmask cloud mask band and other quality layers. In the earlier global cropland extent product @ 30m (GCEP30) Landsat 8/16-day data were used to time-composite 10-band (blue, green, red, NIR, SWIR1, SWIR2, TIR, EVI, NDWI, NDVI) Landsat 30m data cubes for every 2-4 months over a 3–4-year period (for nominal year 2015) along with 2 additional 30m bands (SRTM elevation and slope). However, the HLSL30 and HLSS30 provide significant advances such as the sub-5-day (2-3 days optimal possible as per Masek et al., 2022) coverage, presence of red-edge bands, many possibilities of data transformations like the vegetation indices, and improved processing and consistency of the HLS data (Masek et al., 2022, Wulder et al., 2019, Roy et al., 2017). We will create analysis ready data (ARD) cubes utilizing these bands to best process each of the cropland products. The ARD cubes, processed in GEE, will involve these bands, their transformations (e.g., vegetation indices), and numerous ancillary data (e.g., climate).
Once the above products are established, other products such as the following can be derived using the above products and certain other inputs:
5) Crop productivity (productivity per unit of land; kg\m2)
6) Water productivity (crop per drop or productivity per unit of water; kg\m3).
The GFSAD has released two global products that can be downloaded from NASA's LP DAAC. These products are:
https://lpdaac.usgs.gov/news/release-of-lgrip30-data-product/
https://lpdaac.usgs.gov/news/release-of-gfsad-30-meter-cropland-extent-products/
These products can also be viewed live at:
https://www.usgs.gov/apps/croplands/app/map
A global synthesis work summarizing the methods and results of the entire GFSAD30 global cropland extent product was released as the USGS Professional Paper 1868:
https://pubs.er.usgs.gov/publication/pp1868
Since the release of the GFSAD30 cropland extent product, the downloads from LPDAAC and citations have been tracked and published in the Open File Report 2022-1001 at:
https://pubs.er.usgs.gov/publication/ofr20221001
Relevant methodology including Models and Algorithms used by the group.
Below are multimedia items associated with this project.
--the increasing need for food production, cropland areas, and agricultural water
by Prasad Thenkabail, Research Geographer
--the increasing need for food production, cropland areas, and agricultural water
by Prasad Thenkabail, Research Geographer
Below are news stories associated with this project.