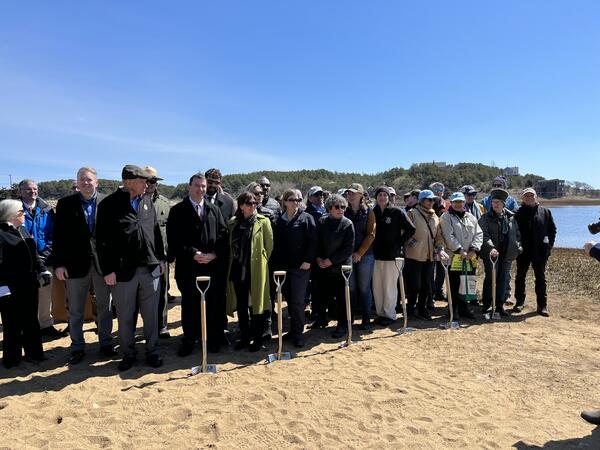
U.S. flag

An official website of the United States government

Images

Woods Hole Coastal and Marine Science Center images

Filter Total Items: 1297
Hurricane Florence geonarrative motivation page
Hurricane Florence Numerical Modeling Geonarrative

The USGS partnered with North Carolina State University, Louisiana State University, and University Corporation for Atmospheric Research to investigate hurricane-induced compound flooding and sediment dispersal using coupled hydrology and ocean models.

The USGS partnered with North Carolina State University, Louisiana State University, and University Corporation for Atmospheric Research to investigate hurricane-induced compound flooding and sediment dispersal using coupled hydrology and ocean models.

Bathymetric map of Cape Cod Bay
Bathymetry of Cape Cod Bay, MA

Bathymetry of Cape Cod Bay, MA collected in 2019. Warmer colors indicate shallow depths while cool colors indicate deeper depths. 

Bathymetry of Cape Cod Bay, MA collected in 2019. Warmer colors indicate shallow depths while cool colors indicate deeper depths. 

Chart with arrow pointing from fabric to hazards to fabric + hazards = CCL outcomes
Coastal Change Likelihood

Where are coastal landscapes likely to change?

Coastal Change Likelihood map of Chesapeake, VA
Coastal Change Likelihood

The U.S. Geological Survey, in cooperation with the National Park Service, developed the Coastal Change Likelihood assessment to determine the future likelihood of coastal change along the Northeast U.S. coastline in the next decade. The CCL data displayed here are for the mid-Atlantic Bight, and extend from the shoreline to 10m elevation inland. 

The U.S. Geological Survey, in cooperation with the National Park Service, developed the Coastal Change Likelihood assessment to determine the future likelihood of coastal change along the Northeast U.S. coastline in the next decade. The CCL data displayed here are for the mid-Atlantic Bight, and extend from the shoreline to 10m elevation inland. 

Two maps of coastal change on Cape Cod using the CCL and CVI
CCL and CVI
CCL and CVI
CCL and CVI

The CCL is an updated version of the older Coastal Vulnerability Index, first published in 1999. While the original product was focused on change in the next 50-100 years based solely on sea level rise, the new CCL is more near-term, focusing on change over the next decade as a result of multiple coastal hazards.

The CCL is an updated version of the older Coastal Vulnerability Index, first published in 1999. While the original product was focused on change in the next 50-100 years based solely on sea level rise, the new CCL is more near-term, focusing on change over the next decade as a result of multiple coastal hazards.

Background images of coastal environments overlaid with coastal change maps
Coastal Change Likelihood

The U.S. Geological Survey, in cooperation with the National Park Service, developed the Coastal Change Likelihood assessment to determine the future likelihood of coastal change along the Northeast U.S. coastline in the next decade. 

The U.S. Geological Survey, in cooperation with the National Park Service, developed the Coastal Change Likelihood assessment to determine the future likelihood of coastal change along the Northeast U.S. coastline in the next decade. 

Coastal Change Likelihood fabric data map for Chesapeake, VA
Coastal Change Likelihood - Fabric Data

The assessment integrates data describing coastal characteristics, landscape composition, and the level of resistance to change to produce the initial fabric layer. 

The assessment integrates data describing coastal characteristics, landscape composition, and the level of resistance to change to produce the initial fabric layer. 

CCL perpetual hazard data map of Chesapeake, VA
Coastal Change Likelihood - Perpetual Hazard Data

Data defining the drivers of change that impact the coast, such as waves and flooding are synthesized in hazards layers. 

CCL map and CVI map gif
Coastal Change Likelihood

The CCL is an updated version of the older Coastal Vulnerability Index, first published in 1999. While the original product was focused on change in the next 50-100 years based solely on sea level rise, the new CCL is more near-term, focusing on change over the next decade as a result of multiple coastal hazards.

The CCL is an updated version of the older Coastal Vulnerability Index, first published in 1999. While the original product was focused on change in the next 50-100 years based solely on sea level rise, the new CCL is more near-term, focusing on change over the next decade as a result of multiple coastal hazards.

Map of Cape Cod showing coastal change likelihood
Coastal Change Likelihood

The U.S. Geological Survey, in cooperation with the National Park Service, developed the Coastal Change Likelihood assessment to determine the future likelihood of coastal change along the Northeast coastline in the next decade. Pictured here is coastal change likelihood on Cape Cod.

The U.S. Geological Survey, in cooperation with the National Park Service, developed the Coastal Change Likelihood assessment to determine the future likelihood of coastal change along the Northeast coastline in the next decade. Pictured here is coastal change likelihood on Cape Cod.

CCL fabric data map of the Chesapeake, VA
Coastal Change Likelihood - Fabric Data

The CCL assessment integrates data describing coastal characteristics, landscape composition, and the level of resistance to change, with data defining the drivers of change that impact the coast, such as waves and flooding. These data types are known as fabric and hazards, respectively.

The CCL assessment integrates data describing coastal characteristics, landscape composition, and the level of resistance to change, with data defining the drivers of change that impact the coast, such as waves and flooding. These data types are known as fabric and hazards, respectively.

Coastal Change Likelihood map of Chesapeake, VA
Coastal Change Likelihood

The U.S. Geological Survey, in cooperation with the National Park Service, developed the Coastal Change Likelihood assessment to determine the future likelihood of coastal change along the Northeast U.S. coastline in the next decade. Here is the CCL map for Chesapeake, Va.

The U.S. Geological Survey, in cooperation with the National Park Service, developed the Coastal Change Likelihood assessment to determine the future likelihood of coastal change along the Northeast U.S. coastline in the next decade. Here is the CCL map for Chesapeake, Va.

Coastal Vulnerability Index map of Cape Cod, MA
Coastal Vulnerability Index - 1999

The CCL is an updated version of the older Coastal Vulnerability Index, first published in 1999. While the original product was focused on change in the next 50-100 years based solely on sea level rise, the new CCL is more near-term, focusing on change over the next decade as a result of multiple coastal hazards.

The CCL is an updated version of the older Coastal Vulnerability Index, first published in 1999. While the original product was focused on change in the next 50-100 years based solely on sea level rise, the new CCL is more near-term, focusing on change over the next decade as a result of multiple coastal hazards.

Coastal Change Likelihood map of Chesapeake, VA
Coastal Change Likelihood

The U.S. Geological Survey, in cooperation with the National Park Service, developed the Coastal Change Likelihood assessment to determine the future likelihood of coastal change along the Northeast U.S. coastline in the next decade. 

The U.S. Geological Survey, in cooperation with the National Park Service, developed the Coastal Change Likelihood assessment to determine the future likelihood of coastal change along the Northeast U.S. coastline in the next decade. 

Coastal Vulnerability Index map of Chesapeake, VA
Coastal Vulnerability Index

The CCL is an updated version of the older Coastal Vulnerability Index, first published in 1999. While the original product was focused on change in the next 50-100 years based solely on sea level rise, the new CCL is more near-term, focusing on change over the next decade as a result of multiple coastal hazards.

The CCL is an updated version of the older Coastal Vulnerability Index, first published in 1999. While the original product was focused on change in the next 50-100 years based solely on sea level rise, the new CCL is more near-term, focusing on change over the next decade as a result of multiple coastal hazards.

Headshot of man smiling at camera
ganju_headshot.jpg
ganju_headshot.jpg
ganju_headshot.jpg

Headshot of Neil Kamal Ganju, a Research Oceanographer with the USGS Woods Hole Coastal and Marine Science Center.

Headshot of Neil Kamal Ganju, a Research Oceanographer with the USGS Woods Hole Coastal and Marine Science Center.

Map of the US east coast, displaying sea-floor mapping achievements from 2022
Sea-Floor Mapping: 2022 by the numbers

The year of 2022 was big for the Sea-Floor Mapping Group at the Woods Hole Coastal and Marine Science Center! These data were collected as part of a collaborative research program and include data collected by USGS and our partners.

The year of 2022 was big for the Sea-Floor Mapping Group at the Woods Hole Coastal and Marine Science Center! These data were collected as part of a collaborative research program and include data collected by USGS and our partners.

Cover of 2023 annual report showing three people on the deck of a ship
2023 Woods Hole Annual Report

The 2023 annual report of the U.S. Geological Survey Woods Hole Coastal and Marine Science Center highlights accomplishments of 2023, includes a list of 2023 publications, and summarizes the work of the center, as well as the work of each of its science groups.

The 2023 annual report of the U.S. Geological Survey Woods Hole Coastal and Marine Science Center highlights accomplishments of 2023, includes a list of 2023 publications, and summarizes the work of the center, as well as the work of each of its science groups.

2022 Woods Hole Annual Report cover showing the back of a person in diving gear in front of a body of water
2022 Annual Report Cover

The 2022 annual report of the U.S. Geological Survey Woods Hole Coastal and Marine Science Center highlights accomplishments of 2022, includes a list of 2022 publications, and summarizes the work of the center, as well as the work of each of its science groups.

The 2022 annual report of the U.S. Geological Survey Woods Hole Coastal and Marine Science Center highlights accomplishments of 2022, includes a list of 2022 publications, and summarizes the work of the center, as well as the work of each of its science groups.

two people on green boardwalk in marsh with green and grey grasses and blue sky
2022 Coring
2022 Coring
2022 Coring

As sea levels rise, salt water extends further up tidal rivers. As sea-level rise accelerates, vegetation transitions are increasingly observed and USGS scientists are busy assessing those changes. USGS scientists take soil cores in the marsh. 

As sea levels rise, salt water extends further up tidal rivers. As sea-level rise accelerates, vegetation transitions are increasingly observed and USGS scientists are busy assessing those changes. USGS scientists take soil cores in the marsh. 

Two people stand in marsh with tube partially in the ground to core marsh
Coring in the Marsh
Coring in the Marsh
Coring in the Marsh

USGS scientists collect core samples from marsh to explore the drives of wetland accretion in the face of rising seas and human impacts impact the evolution on salt marshes.

USGS scientists collect core samples from marsh to explore the drives of wetland accretion in the face of rising seas and human impacts impact the evolution on salt marshes.

Was this page helpful?