
Static stress change models for known or hypothesized faults in the Hispaniola and Puerto Rico subduction segments due to (a) slip on a patch of the Puerto Rico subduction zone, and (b) slip on a patch of the Hispaniola subduction zone. An open arrow denotes slip direction and the patches are marked by dashed rectangles.
Images
Woods Hole Coastal and Marine Science Center images
Filter Total Items: 1312

Static stress change models
Static stress change models for known or hypothesized faults in the Hispaniola and Puerto Rico subduction segments due to (a) slip on a patch of the Puerto Rico subduction zone, and (b) slip on a patch of the Hispaniola subduction zone. An open arrow denotes slip direction and the patches are marked by dashed rectangles.

Northern Alaska and potential gas hydrate occurences
Northern Alaska and potential gas hydrate occurences

Instrumented Pressure Testing Chamber
A pressurized, stable, hydrate-bearing sediment core can be fed through the IPTC body, shown here being used in Singapore to support the Indian National Gas Hydrates Program (NGHP1)
A pressurized, stable, hydrate-bearing sediment core can be fed through the IPTC body, shown here being used in Singapore to support the Indian National Gas Hydrates Program (NGHP1)

Arctic Ocean Extended Continental Shelf Surveys 2008-2011
Arctic Ocean Extended Continental Shelf Surveys 2008-2011Helicopter on the deck of a Canadian coast guard ice breaker ship in the Arctic Ocean.
Arctic Ocean Extended Continental Shelf Surveys 2008-2011
Arctic Ocean Extended Continental Shelf Surveys 2008-2011Helicopter on the deck of a Canadian coast guard ice breaker ship in the Arctic Ocean.

Protected Species Observer aboard CCGS Louis S. St-Laurent
Protected Species Observer aboard CCGS Louis S. St-LaurentProtected Species Observer aboard CCGS Louis S. St-Laurent
Protected Species Observer aboard CCGS Louis S. St-Laurent
Protected Species Observer aboard CCGS Louis S. St-LaurentProtected Species Observer aboard CCGS Louis S. St-Laurent

U.S. and Canadian Ships in Arctic Ocean
Helicopter view of Canadian Coast Guard Ship Louis S. St. Laurent (top) and U.S. Coast Guard Cutter Healy (bottom) on the Arctic Ocean. This was during a scientific expedition to map the extended continental shelf in the Arctic Ocean.
Helicopter view of Canadian Coast Guard Ship Louis S. St. Laurent (top) and U.S. Coast Guard Cutter Healy (bottom) on the Arctic Ocean. This was during a scientific expedition to map the extended continental shelf in the Arctic Ocean.

Sonobuoy reciever launch
Launching a sonobuoy receiver off the end of CCGS Louis S. St-Laurent
Launching a sonobuoy receiver off the end of CCGS Louis S. St-Laurent

Shaded relief image of Woods Hole, MA
Shaded relief image of Woods Hole, MA
Shaded relief image of Woods Hole, MA

Bathymetry of southern Gulf of Maine and Massachusetts coastal zone
Bathymetry of southern Gulf of Maine and Massachusetts coastal zoneBathymetry of of the southern Gulf of Maine with the Massachusetts coastal zone boundary outlined in grey.
Bathymetry of southern Gulf of Maine and Massachusetts coastal zone
Bathymetry of southern Gulf of Maine and Massachusetts coastal zoneBathymetry of of the southern Gulf of Maine with the Massachusetts coastal zone boundary outlined in grey.

Shipwreck near Cuttyhunk, MA
Shaded relief backscatter image of a shipwreck near Cuttyhunk, MA
Shaded relief backscatter image of a shipwreck near Cuttyhunk, MA

Sediment Textures
Inner continental shelf sediment textures within western Massachusetts Bay classified using Barnhardt and others (1998). Bottom photographs A-D show sediment texture in select locations (photograph locations are shown as white dots on the sediment texture map).
Inner continental shelf sediment textures within western Massachusetts Bay classified using Barnhardt and others (1998). Bottom photographs A-D show sediment texture in select locations (photograph locations are shown as white dots on the sediment texture map).

Southern Gulf of Maine and Massachusetts coastal zone bathymetry
Southern Gulf of Maine and Massachusetts coastal zone bathymetryImage showing the bathymetry of the southern Gulf of Maine with the Massachusetts coastal zone boundary outlined in grey. The images on the right display how the geophysical and sample data are combined to create an interpretation of seafloor geology

Swath Bathymetry
Swath bathymetry and derivative products such as slope, hillshaded relief, and rugosity maps provide information not only on water depth, but also the roughness and smoothness of the sea floor, which correlates with sea floor texture and depositional environment.
Swath bathymetry and derivative products such as slope, hillshaded relief, and rugosity maps provide information not only on water depth, but also the roughness and smoothness of the sea floor, which correlates with sea floor texture and depositional environment.

Data input heirarchy
Sediment texture and distribution data were mapped qualitatively in Esri ArcGIS using a hierarchical methodology. Backscatter data were the first input, followed by bathymetry, surficial geologic and shallow stratigraphic interpretations, and photograph and sample databases. DEM, digital elevation model.
Sediment texture and distribution data were mapped qualitatively in Esri ArcGIS using a hierarchical methodology. Backscatter data were the first input, followed by bathymetry, surficial geologic and shallow stratigraphic interpretations, and photograph and sample databases. DEM, digital elevation model.

Bathymetry surrounding Martha's Vineyard, MA
Oblique hillshaded-relief view of the bathymetry surrounding Martha’s Vineyard and the Upper Cape looking south across Buzzards Bay and Vineyard Sound
Oblique hillshaded-relief view of the bathymetry surrounding Martha’s Vineyard and the Upper Cape looking south across Buzzards Bay and Vineyard Sound
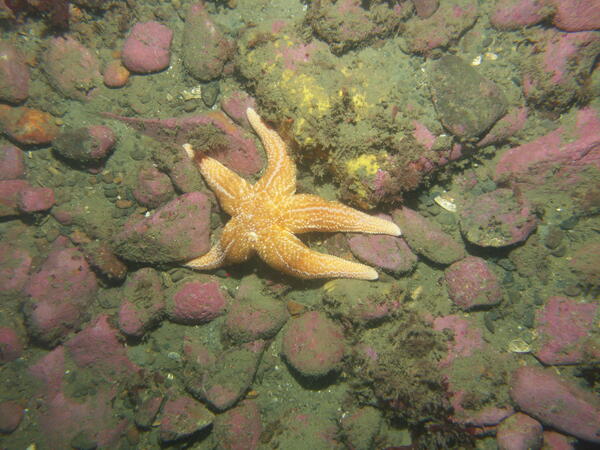
Photograph of a starfish on the sea floor, offshore of Duxbury to Hull, Massachusetts
Photograph of a starfish on the sea floor, offshore of Duxbury to Hull, MassachusettsPhotograph of a starfish on the sea floor, offshore of Duxbury to Hull, Massachusetts
Photograph of a starfish on the sea floor, offshore of Duxbury to Hull, Massachusetts
Photograph of a starfish on the sea floor, offshore of Duxbury to Hull, MassachusettsPhotograph of a starfish on the sea floor, offshore of Duxbury to Hull, Massachusetts

Fire Island, NY beach houses
Beach front houses on Fire Island, NY

Seafloor map of Puerto Rico Trench
A NOAA image of the bathymetry north of Puerto Rico. Two ancient submarine landslides are visible as head scarps (labeled Loiza and Arecibo Amphitheaters). Seafloor fissures are indicated by black arrows, and dashed lines outline debris flows from past failures. Map annotated by Uri ten Brink, USGS
A NOAA image of the bathymetry north of Puerto Rico. Two ancient submarine landslides are visible as head scarps (labeled Loiza and Arecibo Amphitheaters). Seafloor fissures are indicated by black arrows, and dashed lines outline debris flows from past failures. Map annotated by Uri ten Brink, USGS

Didemnum vexillum
Didemnum vexillum

Shaded relief image of Red Brook Harbor
Shaded relief image of Red Brook, Massachusetts Harbor
Shaded relief image of Red Brook, Massachusetts Harbor

Shaded relief image of Quicks Hole, Massachusetts
Shaded relief image of Quicks Hole, Massachusetts
Shaded relief image of Quicks Hole, Massachusetts