
The assessment integrates data describing coastal characteristics, landscape composition, and the level of resistance to change to produce the initial fabric layer.
Images
Woods Hole Coastal and Marine Science Center images
Filter Total Items: 1312

Coastal Change Likelihood - Fabric Data
The assessment integrates data describing coastal characteristics, landscape composition, and the level of resistance to change to produce the initial fabric layer.

Coastal Change Likelihood
The CCL is an updated version of the older Coastal Vulnerability Index, first published in 1999. While the original product was focused on change in the next 50-100 years based solely on sea level rise, the new CCL is more near-term, focusing on change over the next decade as a result of multiple coastal hazards.
The CCL is an updated version of the older Coastal Vulnerability Index, first published in 1999. While the original product was focused on change in the next 50-100 years based solely on sea level rise, the new CCL is more near-term, focusing on change over the next decade as a result of multiple coastal hazards.

Coastal Change Likelihood - Perpetual Hazard Data
Data defining the drivers of change that impact the coast, such as waves and flooding are synthesized in hazards layers.
Data defining the drivers of change that impact the coast, such as waves and flooding are synthesized in hazards layers.

Coastal Vulnerability Index
The CCL is an updated version of the older Coastal Vulnerability Index, first published in 1999. While the original product was focused on change in the next 50-100 years based solely on sea level rise, the new CCL is more near-term, focusing on change over the next decade as a result of multiple coastal hazards.
The CCL is an updated version of the older Coastal Vulnerability Index, first published in 1999. While the original product was focused on change in the next 50-100 years based solely on sea level rise, the new CCL is more near-term, focusing on change over the next decade as a result of multiple coastal hazards.

Coastal Change Likelihood - Fabric Data
The CCL assessment integrates data describing coastal characteristics, landscape composition, and the level of resistance to change, with data defining the drivers of change that impact the coast, such as waves and flooding. These data types are known as fabric and hazards, respectively.
The CCL assessment integrates data describing coastal characteristics, landscape composition, and the level of resistance to change, with data defining the drivers of change that impact the coast, such as waves and flooding. These data types are known as fabric and hazards, respectively.

Coastal Change Likelihood
The U.S. Geological Survey, in cooperation with the National Park Service, developed the Coastal Change Likelihood assessment to determine the future likelihood of coastal change along the Northeast U.S. coastline in the next decade. Here is the CCL map for Chesapeake, Va.
The U.S. Geological Survey, in cooperation with the National Park Service, developed the Coastal Change Likelihood assessment to determine the future likelihood of coastal change along the Northeast U.S. coastline in the next decade. Here is the CCL map for Chesapeake, Va.

Coastal Vulnerability Index - 1999
The CCL is an updated version of the older Coastal Vulnerability Index, first published in 1999. While the original product was focused on change in the next 50-100 years based solely on sea level rise, the new CCL is more near-term, focusing on change over the next decade as a result of multiple coastal hazards.
The CCL is an updated version of the older Coastal Vulnerability Index, first published in 1999. While the original product was focused on change in the next 50-100 years based solely on sea level rise, the new CCL is more near-term, focusing on change over the next decade as a result of multiple coastal hazards.

Coastal Change Likelihood
The U.S. Geological Survey, in cooperation with the National Park Service, developed the Coastal Change Likelihood assessment to determine the future likelihood of coastal change along the Northeast U.S. coastline in the next decade.
The U.S. Geological Survey, in cooperation with the National Park Service, developed the Coastal Change Likelihood assessment to determine the future likelihood of coastal change along the Northeast U.S. coastline in the next decade.

Coastal Change Likelihood
The U.S. Geological Survey, in cooperation with the National Park Service, developed the Coastal Change Likelihood assessment to determine the future likelihood of coastal change along the Northeast coastline in the next decade. Pictured here is coastal change likelihood on Cape Cod.
The U.S. Geological Survey, in cooperation with the National Park Service, developed the Coastal Change Likelihood assessment to determine the future likelihood of coastal change along the Northeast coastline in the next decade. Pictured here is coastal change likelihood on Cape Cod.

ganju_headshot.jpg
Headshot of Neil Kamal Ganju, a Research Oceanographer with the USGS Woods Hole Coastal and Marine Science Center.
Headshot of Neil Kamal Ganju, a Research Oceanographer with the USGS Woods Hole Coastal and Marine Science Center.

Sea-Floor Mapping: 2022 by the numbers
The year of 2022 was big for the Sea-Floor Mapping Group at the Woods Hole Coastal and Marine Science Center! These data were collected as part of a collaborative research program and include data collected by USGS and our partners.
The year of 2022 was big for the Sea-Floor Mapping Group at the Woods Hole Coastal and Marine Science Center! These data were collected as part of a collaborative research program and include data collected by USGS and our partners.
2023 Woods Hole Annual Report
The 2023 annual report of the U.S. Geological Survey Woods Hole Coastal and Marine Science Center highlights accomplishments of 2023, includes a list of 2023 publications, and summarizes the work of the center, as well as the work of each of its science groups.
The 2023 annual report of the U.S. Geological Survey Woods Hole Coastal and Marine Science Center highlights accomplishments of 2023, includes a list of 2023 publications, and summarizes the work of the center, as well as the work of each of its science groups.

2022 Annual Report Cover
The 2022 annual report of the U.S. Geological Survey Woods Hole Coastal and Marine Science Center highlights accomplishments of 2022, includes a list of 2022 publications, and summarizes the work of the center, as well as the work of each of its science groups.
The 2022 annual report of the U.S. Geological Survey Woods Hole Coastal and Marine Science Center highlights accomplishments of 2022, includes a list of 2022 publications, and summarizes the work of the center, as well as the work of each of its science groups.

2022 Coring
As sea levels rise, salt water extends further up tidal rivers. As sea-level rise accelerates, vegetation transitions are increasingly observed and USGS scientists are busy assessing those changes. USGS scientists take soil cores in the marsh.
As sea levels rise, salt water extends further up tidal rivers. As sea-level rise accelerates, vegetation transitions are increasingly observed and USGS scientists are busy assessing those changes. USGS scientists take soil cores in the marsh.

Coring in the Marsh
USGS scientists collect core samples from marsh to explore the drives of wetland accretion in the face of rising seas and human impacts impact the evolution on salt marshes.
USGS scientists collect core samples from marsh to explore the drives of wetland accretion in the face of rising seas and human impacts impact the evolution on salt marshes.
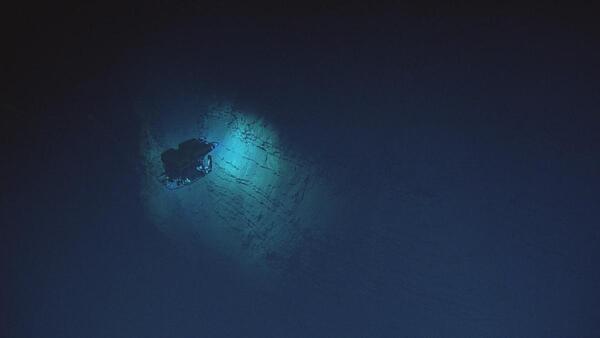
Mona Rift Seafloor
Nautilus dive on the Mona Rift western slope, off the coast of Puerto Rico.
Nautilus dive on the Mona Rift western slope, off the coast of Puerto Rico.
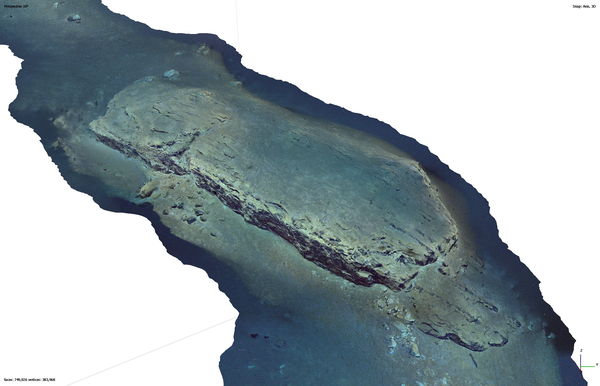
3D Mona Rift Model
A recent study from the U.S. Geological Survey offers a workflow for generating virtual maps of the deep seafloor from archived exploration dives. This work can help advance exploration of the deep-sea frontier and extends into other fields.
A recent study from the U.S. Geological Survey offers a workflow for generating virtual maps of the deep seafloor from archived exploration dives. This work can help advance exploration of the deep-sea frontier and extends into other fields.

Blake DVI test track
Test track from 1970’s commercial dredging equipment trials through a nodule field on the Blake Plateau, imaged in 2022 from an autonomous underwater vehicle (BOEM/USGS).
Test track from 1970’s commercial dredging equipment trials through a nodule field on the Blake Plateau, imaged in 2022 from an autonomous underwater vehicle (BOEM/USGS).

Group Photo
USGS scientists working on FLACC study coastal change, and develop techniques and metrics to measure past, present, and future shoreline change rates along the sandy coasts of the U.S.
USGS scientists working on FLACC study coastal change, and develop techniques and metrics to measure past, present, and future shoreline change rates along the sandy coasts of the U.S.

ROV and Mona Rift dive site
(Top): Map of dives labeled and shown in red and orange located near the Mona Rift, northwest of Puerto Rico. Contours show depths in meters at 500 m intervals. Square indicates location of dive. Bathymetry from Andrews et al. Yellow curve denotes landslide tsunami source of Lopéz-Venegas et al.
(Top): Map of dives labeled and shown in red and orange located near the Mona Rift, northwest of Puerto Rico. Contours show depths in meters at 500 m intervals. Square indicates location of dive. Bathymetry from Andrews et al. Yellow curve denotes landslide tsunami source of Lopéz-Venegas et al.

Collecting Observational Data
Observational data are key to identify landscape change tipping points and the role of invasive species on coastal change. Photo of USGS staff mapping invasive Phragmites on Assateague Island National Seashore. Photo by Seth Ackerman.
Observational data are key to identify landscape change tipping points and the role of invasive species on coastal change. Photo of USGS staff mapping invasive Phragmites on Assateague Island National Seashore. Photo by Seth Ackerman.