
USGS scientists prepare to bring a television news crew on a rainy tour of the flooded Red River in downtown Fargo, where they take water level and streamflow measurements.
Images
Images
Filter Total Items: 9448

Media Film USGS Research in Fargo
USGS scientists prepare to bring a television news crew on a rainy tour of the flooded Red River in downtown Fargo, where they take water level and streamflow measurements.

Souris River near Sherwood, North Dakota
On April 10, 2011, USGS personnel were at the Souris River near Sherwood, ND to measure the streamflow. Streamflow was approximately 2,810 cubic feet per second, stage approximately 19.31 feet.
On April 10, 2011, USGS personnel were at the Souris River near Sherwood, ND to measure the streamflow. Streamflow was approximately 2,810 cubic feet per second, stage approximately 19.31 feet.

Media Coverage of USGS Flood Work
A television news journalist records work being done by USGS scientists at the Red River in downtown Fargo, ND.
A television news journalist records work being done by USGS scientists at the Red River in downtown Fargo, ND.

USGS Red River of the North at Fargo Streamgage
Water level measurement from the USGS Red River of the North at Fargo streamgage in downtown Fargo, ND. The water level peaked at around 39 feet at this streamgage on April 9. Real-time water level and streamflow data from this gage can be accessed online.
Water level measurement from the USGS Red River of the North at Fargo streamgage in downtown Fargo, ND. The water level peaked at around 39 feet at this streamgage on April 9. Real-time water level and streamflow data from this gage can be accessed online.

Des Lacs River near Foxholm North Dakota
April 9, 2011, ice break up in the Des Lacs River near Foxholm, ND.
April 9, 2011, ice break up in the Des Lacs River near Foxholm, ND.

Streamflow and Water Level Measurements
USGS scientists Joel Galloway and Dan Thomas prepare to take streamflow and water level measurements of the flooded Red River in downtown Fargo, ND. The USGS Red River of the North at Fargo streamgage can be seen in the background.
USGS scientists Joel Galloway and Dan Thomas prepare to take streamflow and water level measurements of the flooded Red River in downtown Fargo, ND. The USGS Red River of the North at Fargo streamgage can be seen in the background.

Streamflow and Water Level Measurements
USGS scientists Joel Galloway and Dan Thomas prepare to take streamflow and water level measurements of the flooded Red River in downtown Fargo, ND.
USGS scientists Joel Galloway and Dan Thomas prepare to take streamflow and water level measurements of the flooded Red River in downtown Fargo, ND.

Media Film a USGS Streamgage
USGS scientists Joel Galloway and Dan Thomas bring a television news crew on a tour of the flooded Red River, where they take water level and streamflow measurements during the flood. Here, the crew films footage of the USGS Red River of the North at Fargo streamgage.
USGS scientists Joel Galloway and Dan Thomas bring a television news crew on a tour of the flooded Red River, where they take water level and streamflow measurements during the flood. Here, the crew films footage of the USGS Red River of the North at Fargo streamgage.

USGS Research on the Flooded Red River
The 2011 Red River flood was the third largest in Fargo, ND since 1900. In the background of this photo, USGS authorized personnel take a boat out on the river to record streamflow and water level measurements.
The 2011 Red River flood was the third largest in Fargo, ND since 1900. In the background of this photo, USGS authorized personnel take a boat out on the river to record streamflow and water level measurements.

Cubic Foot - Red River at Fargo
A white box in the foreground of this photograph demonstrates one cubic foot. The peak streamflow at the USGS Red River of the North at Fargo, ND streamgage was around 26,000 cubic feet per second on April 9, 2011.
A white box in the foreground of this photograph demonstrates one cubic foot. The peak streamflow at the USGS Red River of the North at Fargo, ND streamgage was around 26,000 cubic feet per second on April 9, 2011.

Des Lacs River near Foxholm North Dakota
Arpil 9, 2011, ice break up in the Des Lacs River near Foxholm, ND.
Arpil 9, 2011, ice break up in the Des Lacs River near Foxholm, ND.

USGS Red River of the North at Fargo Streamgage
An image of the USGS Red River of the North at Fargo streamgage in downtown Fargo, ND. Real-time water level and streamflow data from this gage can be accessed online.
An image of the USGS Red River of the North at Fargo streamgage in downtown Fargo, ND. Real-time water level and streamflow data from this gage can be accessed online.

USGS Measures Flooding in ND
USGS scientists use an acoustic doppler current profiler to measure streamflow and water currents at Ditch 14 near Fargo, ND.
USGS scientists use an acoustic doppler current profiler to measure streamflow and water currents at Ditch 14 near Fargo, ND.

USGS Measures Flooding in ND
USGS hydrologist Brent Hall measures the water level at Ditch 14 near Fargo, ND.
USGS hydrologist Brent Hall measures the water level at Ditch 14 near Fargo, ND.

USGS Measures Flooding in ND
USGS scientists use an acoustic doppler current profiler to measure streamflow and water currents at Ditch 14 near Fargo, ND.
USGS scientists use an acoustic doppler current profiler to measure streamflow and water currents at Ditch 14 near Fargo, ND.

USGS Measures Flooding in ND
USGS scientists use an acoustic doppler current profiler to measure streamflow and water currents at Ditch 14 near Fargo, ND.
USGS scientists use an acoustic doppler current profiler to measure streamflow and water currents at Ditch 14 near Fargo, ND.

Streamflow and Water Level Measurements
USGS scientists John Miller and Brent Hall measure the streamflow and water levels at the flooded Ditch 14 near Mapleton, ND. What appears to be a lake is actually a flooded cornfield.
USGS scientists John Miller and Brent Hall measure the streamflow and water levels at the flooded Ditch 14 near Mapleton, ND. What appears to be a lake is actually a flooded cornfield.

Flood Data Input
USGS scientist John Miller retrieves acoustic doppler current profiler data for streamflow and water levels at the flooded Ditch 14 near Mapleton, ND.
USGS scientist John Miller retrieves acoustic doppler current profiler data for streamflow and water levels at the flooded Ditch 14 near Mapleton, ND.
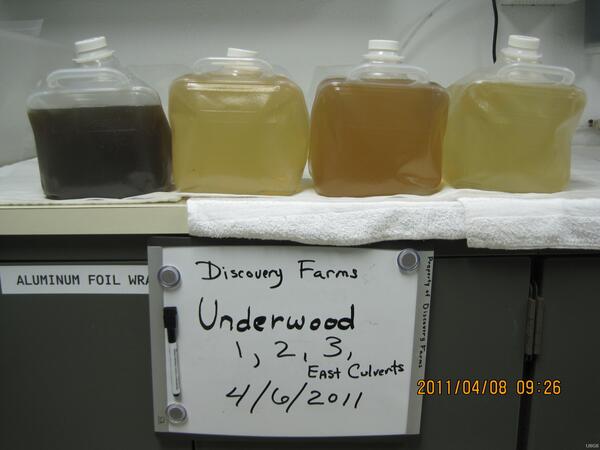
Underwood Grab Samples
Grab samples from North Dakota Discovery Farms Underwood waterway sites 1, 2, 3, and the East Culverts, on April 6, 2011.
Grab samples from North Dakota Discovery Farms Underwood waterway sites 1, 2, 3, and the East Culverts, on April 6, 2011.

Acoustic Doppler Current Profiler
USGS scientist Brent Hall uses an acoustic doppler current profiler to measure the streamflow and water levels at the flooded Ditch 14 near Mapleton, ND.
USGS scientist Brent Hall uses an acoustic doppler current profiler to measure the streamflow and water levels at the flooded Ditch 14 near Mapleton, ND.

USGS Measures Flooding in ND
USGS scientists use an acoustic doppler current profiler to measure streamflow and water currents at Ditch 14 near Fargo, ND.
USGS scientists use an acoustic doppler current profiler to measure streamflow and water currents at Ditch 14 near Fargo, ND.